#025 - Vancouver LIDAR revisited
In contrast to the first attempt that extract ground-tagged points only, this 2.0 script extracts all high-resolution attributes from LIDAR datasets of downtown Vancouver, including ground, high and low vegetation, buildings and roads, and any unassigned noiseless data points. This is a major computational challenge, requiring processing of the full dataset (which weighs 179GB idly), with additional temporary arrays generated during analysis that are equally large. Luckily, we are only interested in the land-sea interface, so processing allows cleaving out all inner-city data, which is also the heaviest. Here we extract only the waterfront of the city, from -10m to +10m elevation, as captured by LIDAR.
The pipeline below has three parts. [1] We load shoreline-containing LAS files, which are 53 out of 181 (29%). This list comes from an analog inspection of the total file grid (post #022 for details). [2] A forloop extracts each LAS file individually and extracts everything except for attributes #7 and #9 (noise and water, respectively) and any elevation above 10 meters is ignored. There is no bathymetric data in these files, the LIDAR captured the ocean surface directly, resulting in a flat point cloud at around 1.5 meters elevation. Even after removing the #9 attribute, some ocean surface remains (as part of #00 and #01 unclassified and unassigned points). Furthermore, any points below -10 meters are building foundation excavations. [3] These LIDAR data comes in UTM projection, so a final forloop converts it into WGS.
files={'4810E_54560N.las';'4800E_54560N.las';'4800E_54570N.las';
'4810E_54570N.las';'4810E_54580N.las';'4820E_54580N.las';
'4830E_54580N.las';'4840E_54580N.las';'4850E_54580N.las';
'4850E_54570N.las';'4860E_54570N.las';'4870E_54570N.las';
'4880E_54570N.las';'4880E_54580N.las';'4890E_54580N.las';
'4890E_54570N.las';'4900E_54580N.las';'4900E_54570N.las';
'4910E_54570N.las';'4920E_54570N.las';'4920E_54580N.las';
'4890E_54590N.las';'4890E_54600N.las';'4880E_54600N.las';
'4880E_54610N.las';'4880E_54620N.las';'4890E_54620N.las';
'4900E_54610N.las';'4900E_54620N.las';'4900E_54600N.las';
'4910E_54600N.las';'4900E_54590N.las';'4910E_54590N.las';
'4920E_54590N.las';'4930E_54590N.las';'4940E_54590N.las';
'4950E_54590N.las';'4960E_54590N.las';'4960E_54600N.las';
'4970E_54590N.las';'4980E_54590N.las';'4980E_54600N.las';
'4970E_54600N.las';'4910E_54610N.las';'4910E_54580N.las';
'4930E_54570N.las';'4930E_54580N.las';'4890E_54610N.las';
'4940E_54580N.las';'4940E_54570N.las';'4940E_54560N.las';
'4830E_54570N.las';'4840E_54570N.las'};
LidarDefaultX=[];
LidarDefaultY=[];
LidarDefaultZ=[];
for i=1:length(files)
pc=LASread(files{i,1});
noise=ismember(pc.record.classification,7);
water=ismember(pc.record.classification,9);
X=pc.record.x(~noise & ~water);
Y=pc.record.y(~noise & ~water);
Z=pc.record.z(~noise & ~water);
indexZ=find(Z<=10);
X=X(indexZ);
Y=Y(indexZ);
Z=Z(indexZ);
LidarDefaultX=cat(1,LidarDefaultX,X);
LidarDefaultY=cat(1,LidarDefaultY,Y);
LidarDefaultZ=cat(1,LidarDefaultZ,Z);
end
UTM_X=LidarDefaultX;
UTM_Y=LidarDefaultY;
NewX=zeros(length(UTM_X),1);
NewY=zeros(length(UTM_Y),1);
for i=1:length(UTM_X)
b=mod(i,1000000);
if b==0
i % Progress tracking
end
[NewY(i,1),NewX(i,1)]=utm2deg(UTM_X(i,1),UTM_Y(i,1),'10 U');
end
LidarWGS_DefaultX=NewX;
LidarWGS_DefaultY=NewY;
LidarWGS_DefaultZ=LidarDefaultZ;
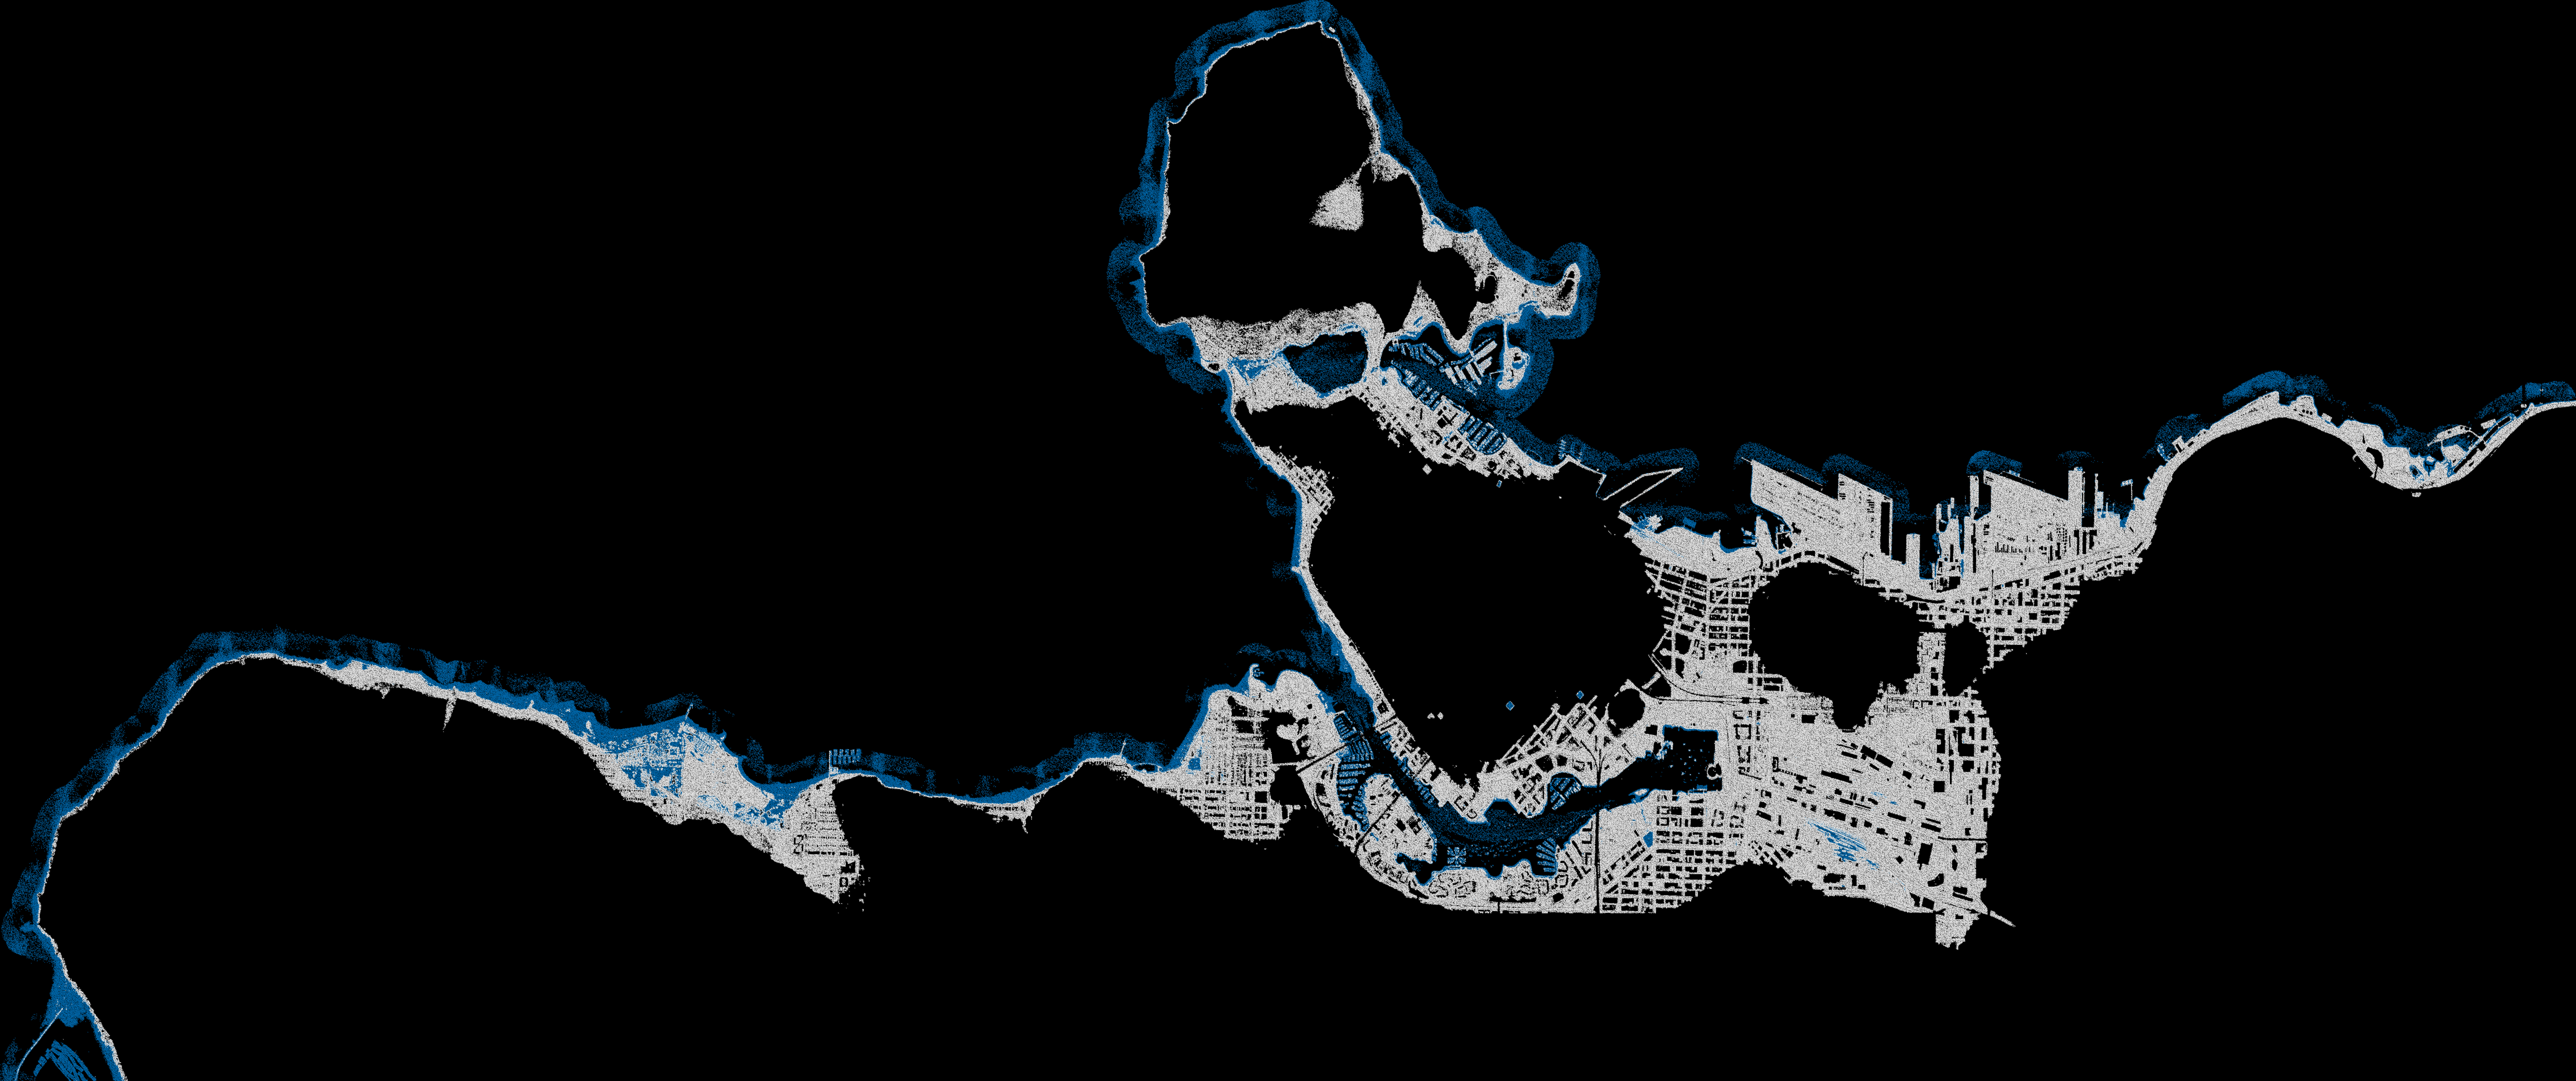
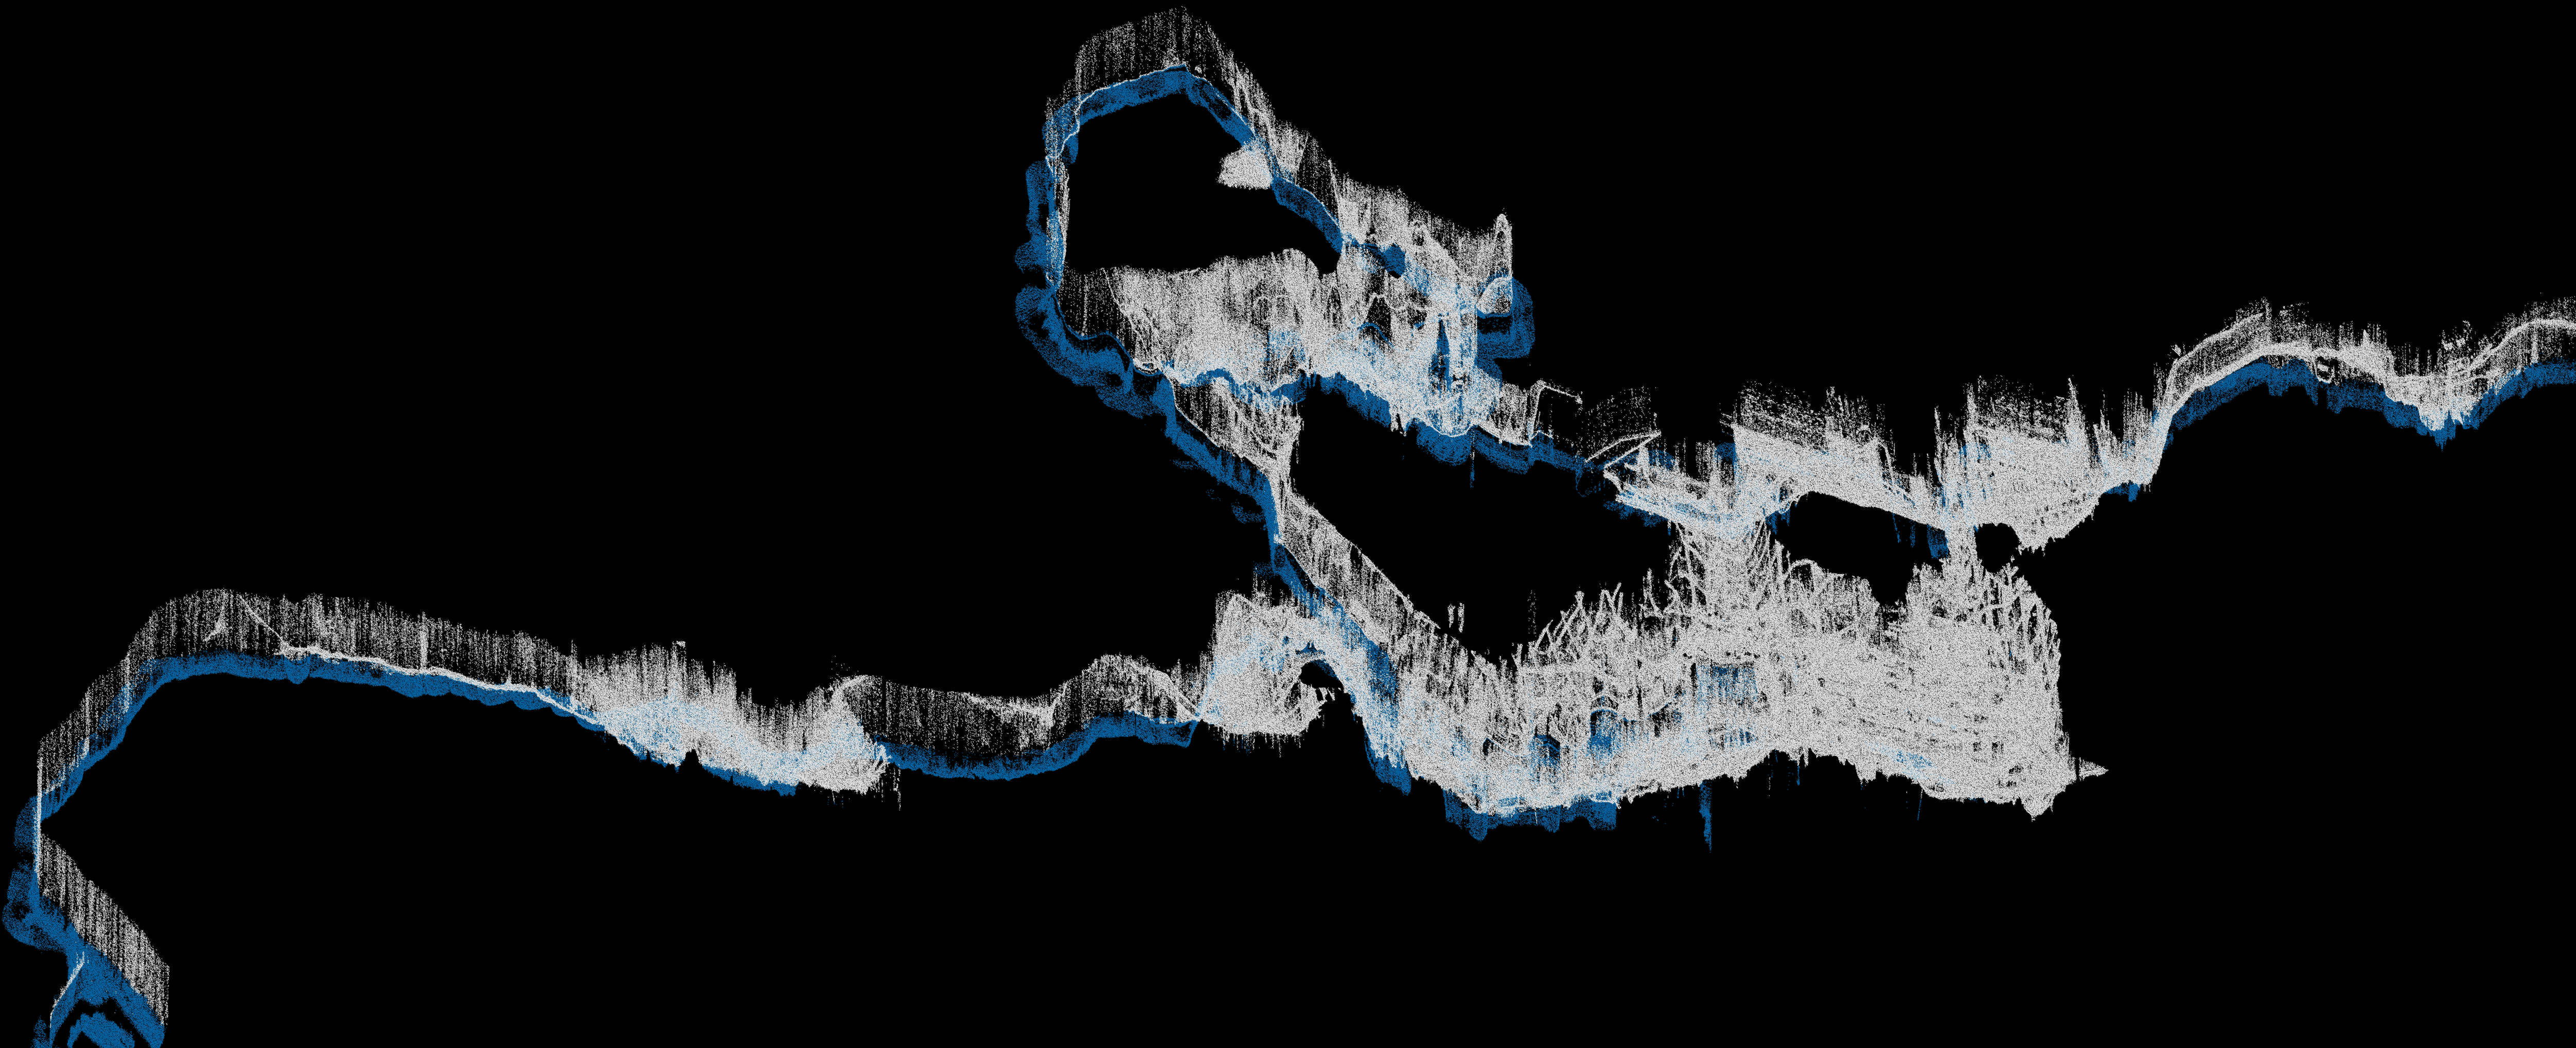
Below=LidarWGS_DefaultZ;Below(Below>=3)=NaN;
Above=LidarWGS_DefaultZ;Above(Above<=3)=NaN;
figure('Position',[10,10,1420,600],'Resize','off','Color','k');hold on;
axis off;axis tight;view(0,90);
scatter3(NewX(1:50:end,1),NewY(1:50:end,1),Below(1:50:end,1),0.025);
scatter3(NewX(1:50:end,1),NewY(1:50:end,1),Above(1:50:end,1),0.025,'w');
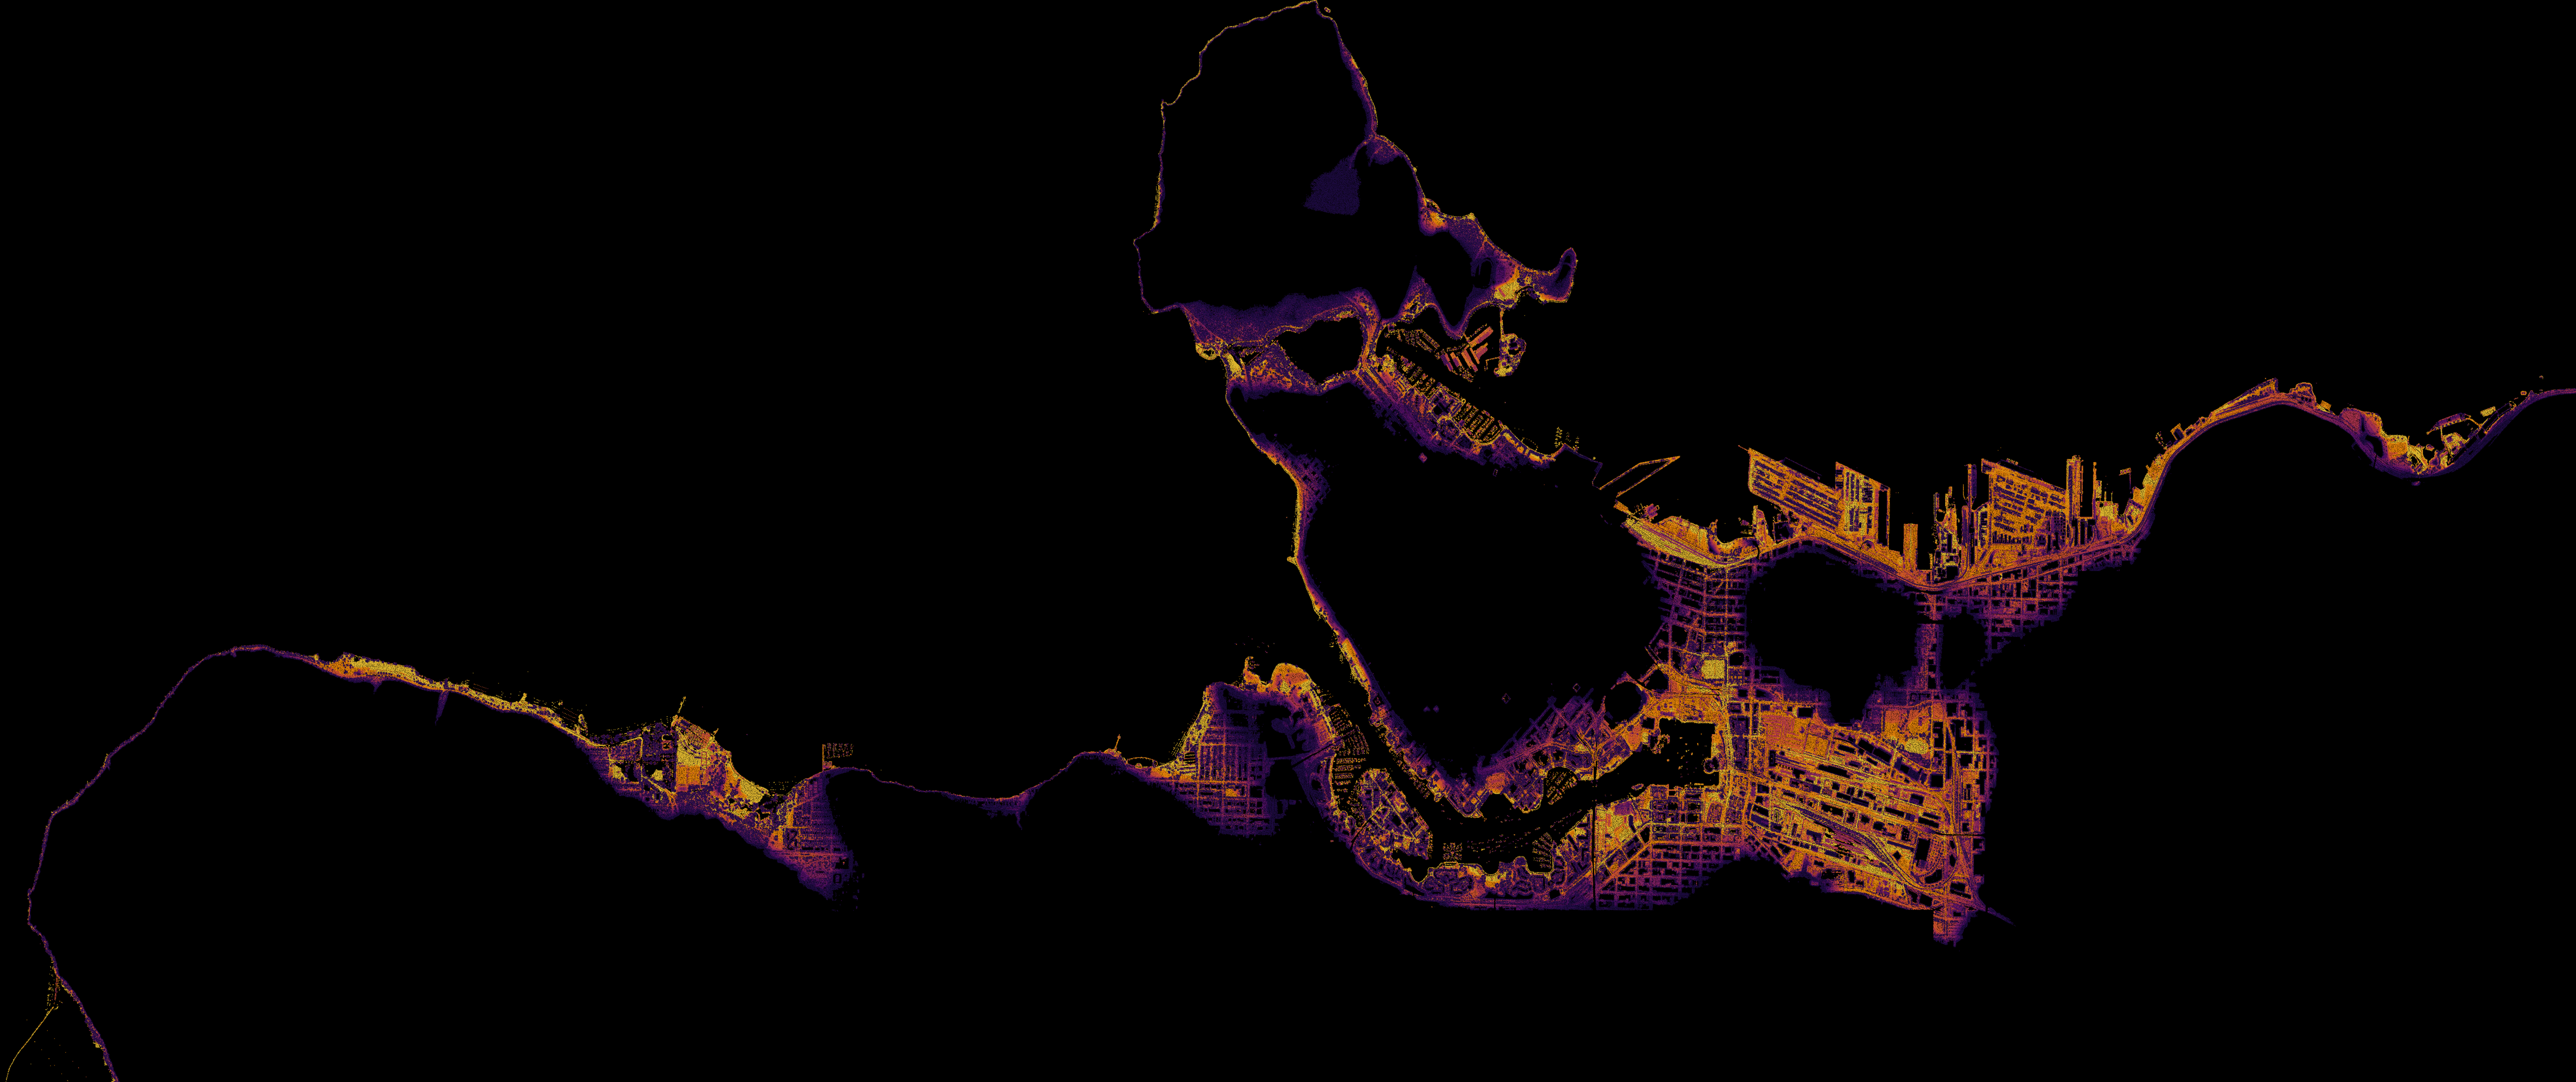
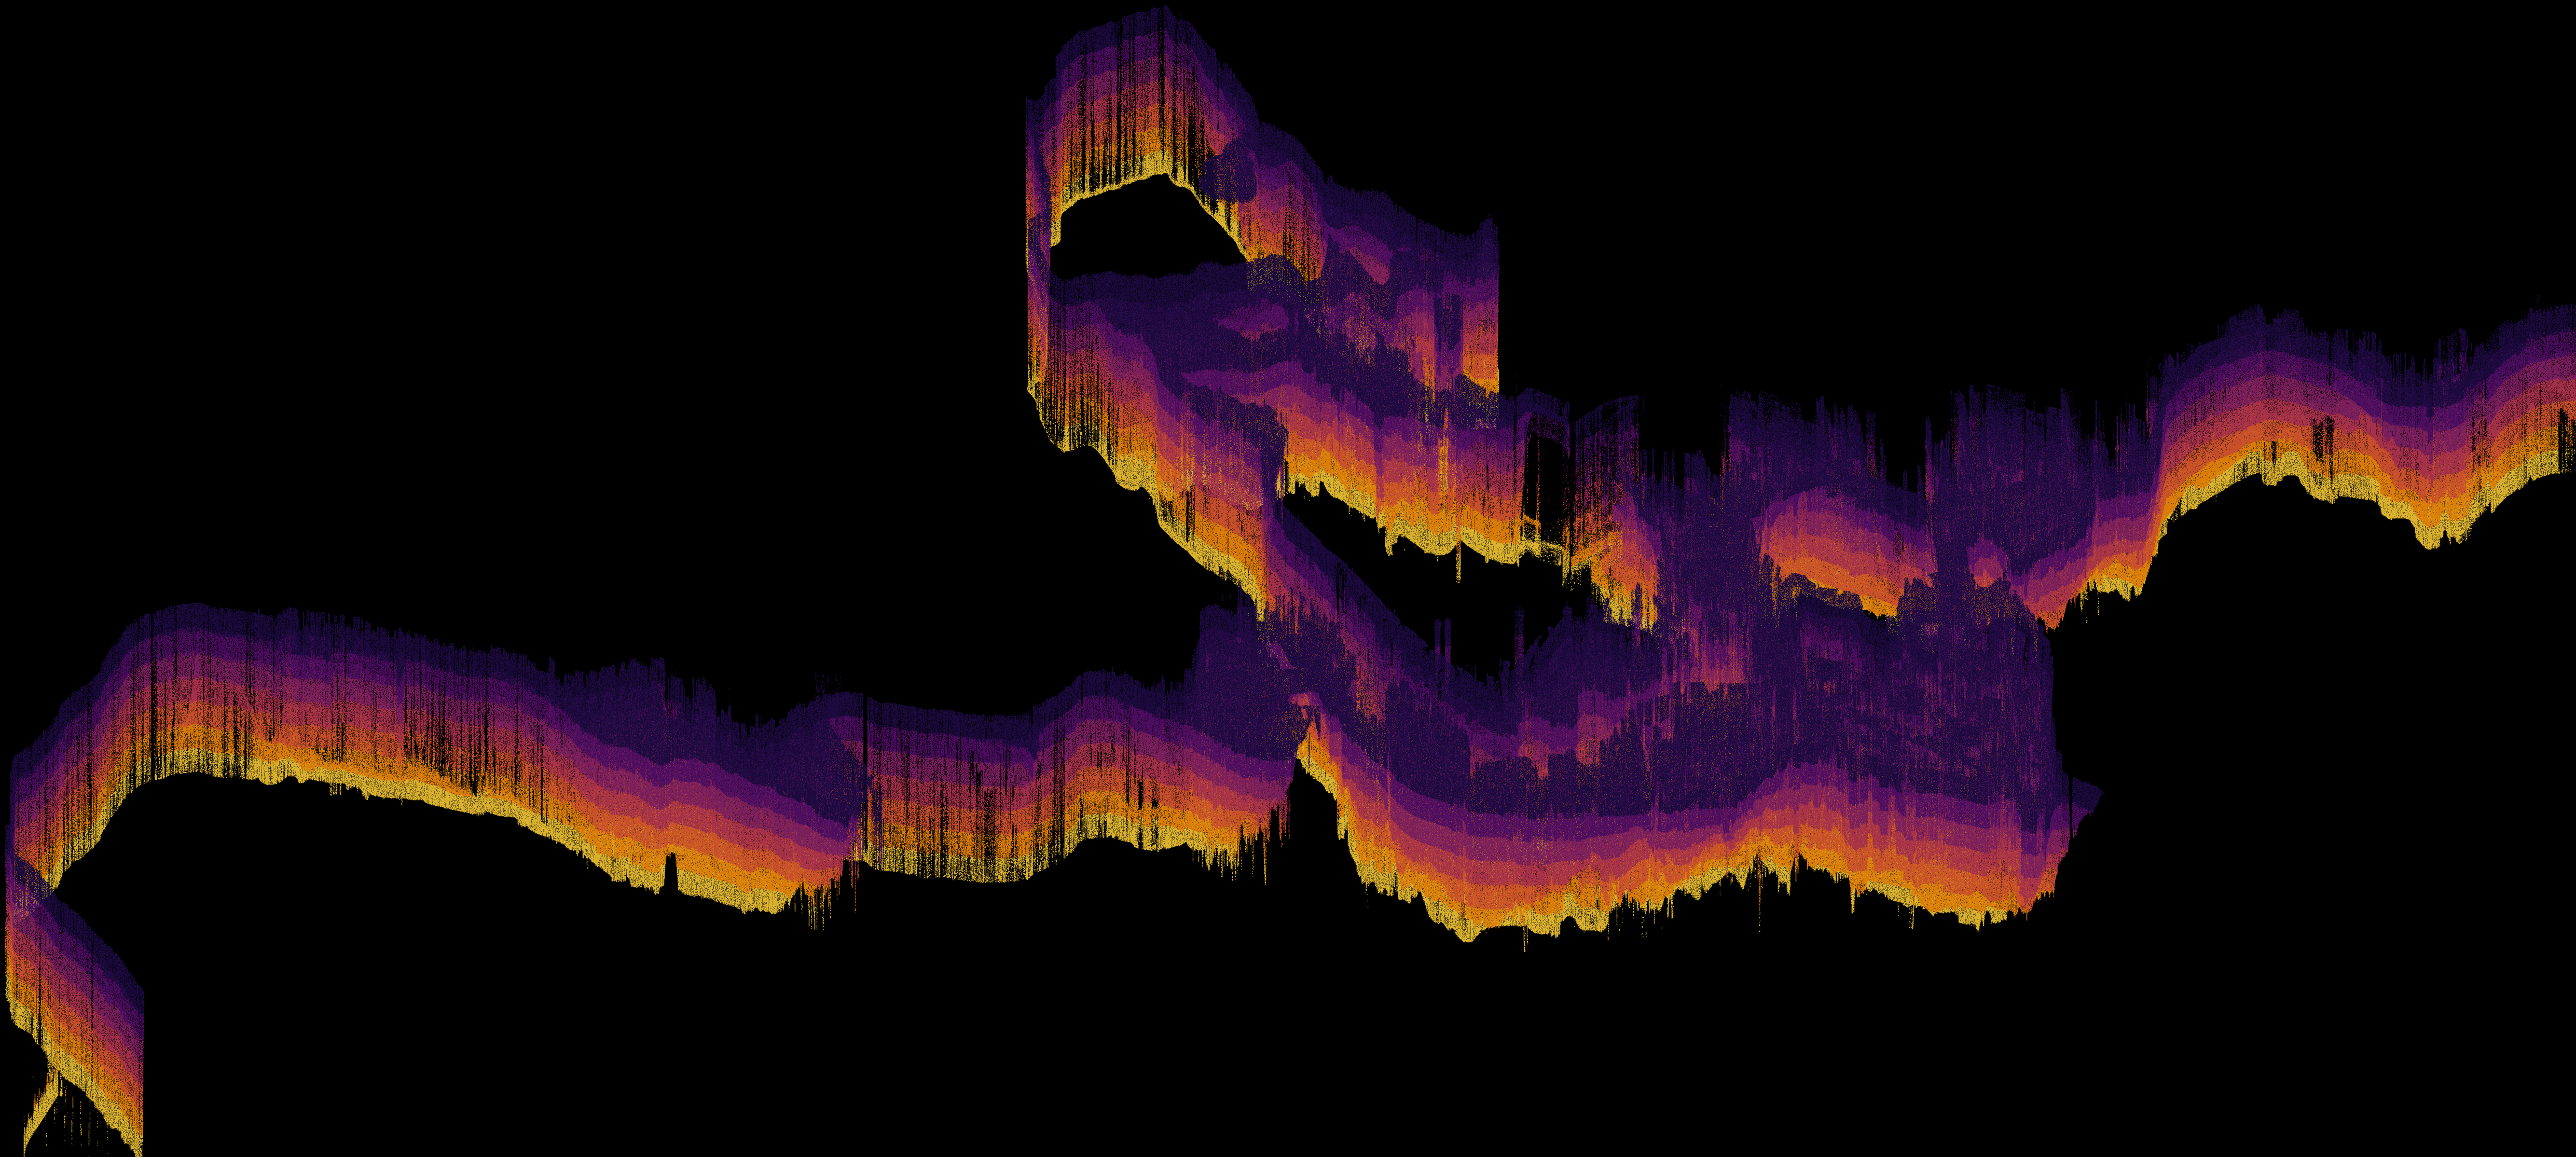
Finally, we can visualize the elevation gradients by coloring the extracted high-resolution Z values.
colors=flipud(inferno(7));
figure('Position',[10,10,1420,600],'Resize','off','Color','k');hold on;
axis off;axis tight;
for i=1:7
    indexZ=find(LidarWGS_DefaultZ>=i+2 & LidarWGS_DefaultZ<i+3);
    X=LidarWGS_DefaultX(indexZ,1);
    Y=LidarWGS_DefaultY(indexZ,1);
    Z=LidarWGS_DefaultZ(indexZ,1);
    scatter3(X,Y,Z,0.025,colors(i,:)); drawnow;
end