
Tools
2026
E3 -- Earth Embeddings Explainer
An interactive visualization tool for probing the embedding space of Geospatial Foundation Models (GFMs). Five linked panes run from familiar satellite imagery to abstract principal components.
Papers
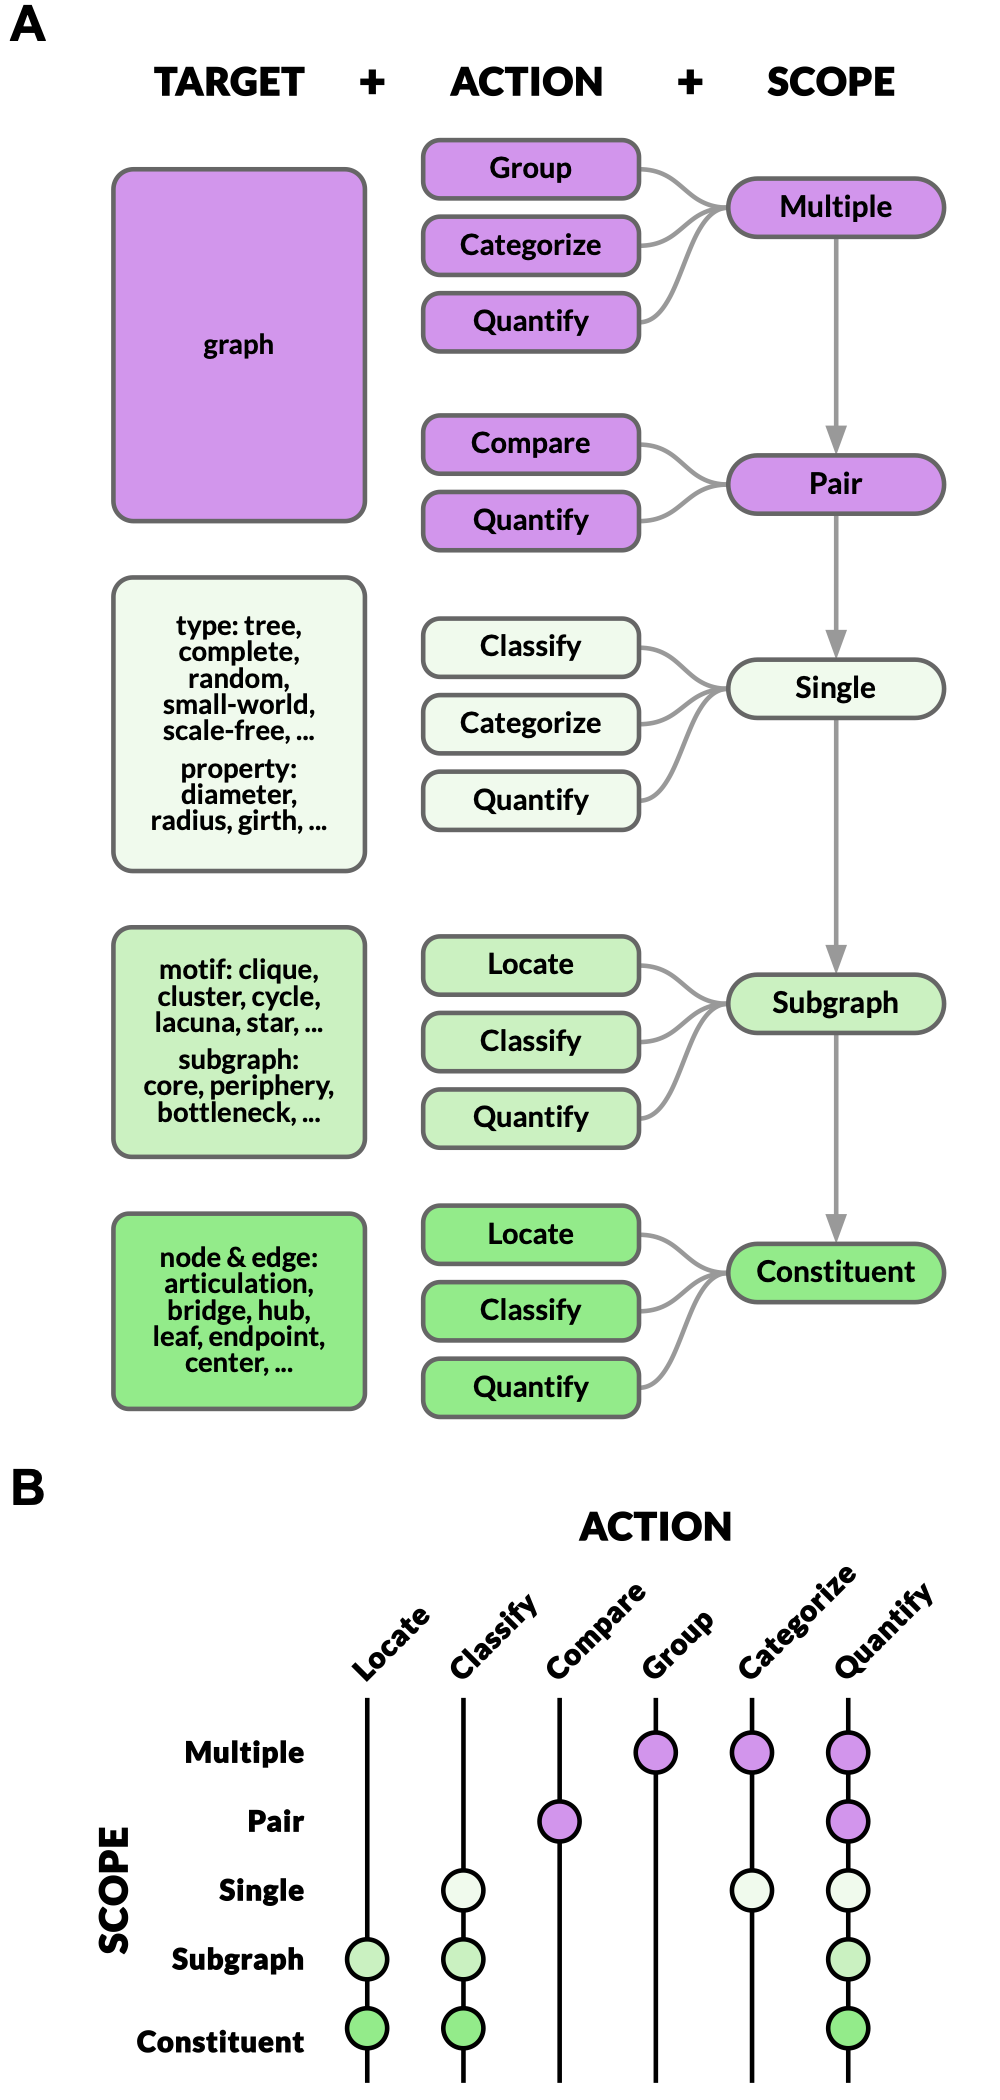
We investigate tasks that can be accomplished with unlabeled graphs, which are graphs with nodes that do not have persistent or semantically meaningful labels attached. New visualization techniques to represent unlabeled graphs have been proposed, but more understanding of unlabeled graph tasks is required before these techniques can be adequately evaluated. Some network visualization tasks apply to both labeled and unlabeled graphs, but many do not translate between these contexts. We propose a data abstraction model that distinguishes the Unlabeled context from the increasingly semantically rich Labeled, Attributed, and Augmented contexts. We filter tasks collected and gleaned from the literature according to our data abstraction and analyze the surfaced tasks, leading to a taxonomy of abstract tasks for unlabeled graphs. Our task taxonomy is organized according to the Target data under consideration, the Action intended by the user, and the Scope of the data at play. We show the descriptive power of this task abstraction by connecting to concrete examples from previous frameworks, and connecting these abstractions to real-world problems. To showcase the evaluative power of the taxonomy, we perform a preliminary assessment across 6 different network visualization idioms for each task. For each combination of task and visual encoding, we consider the effort required from viewers, the likelihood of task success, and how both factors vary between small-scale and large-scale graphs.
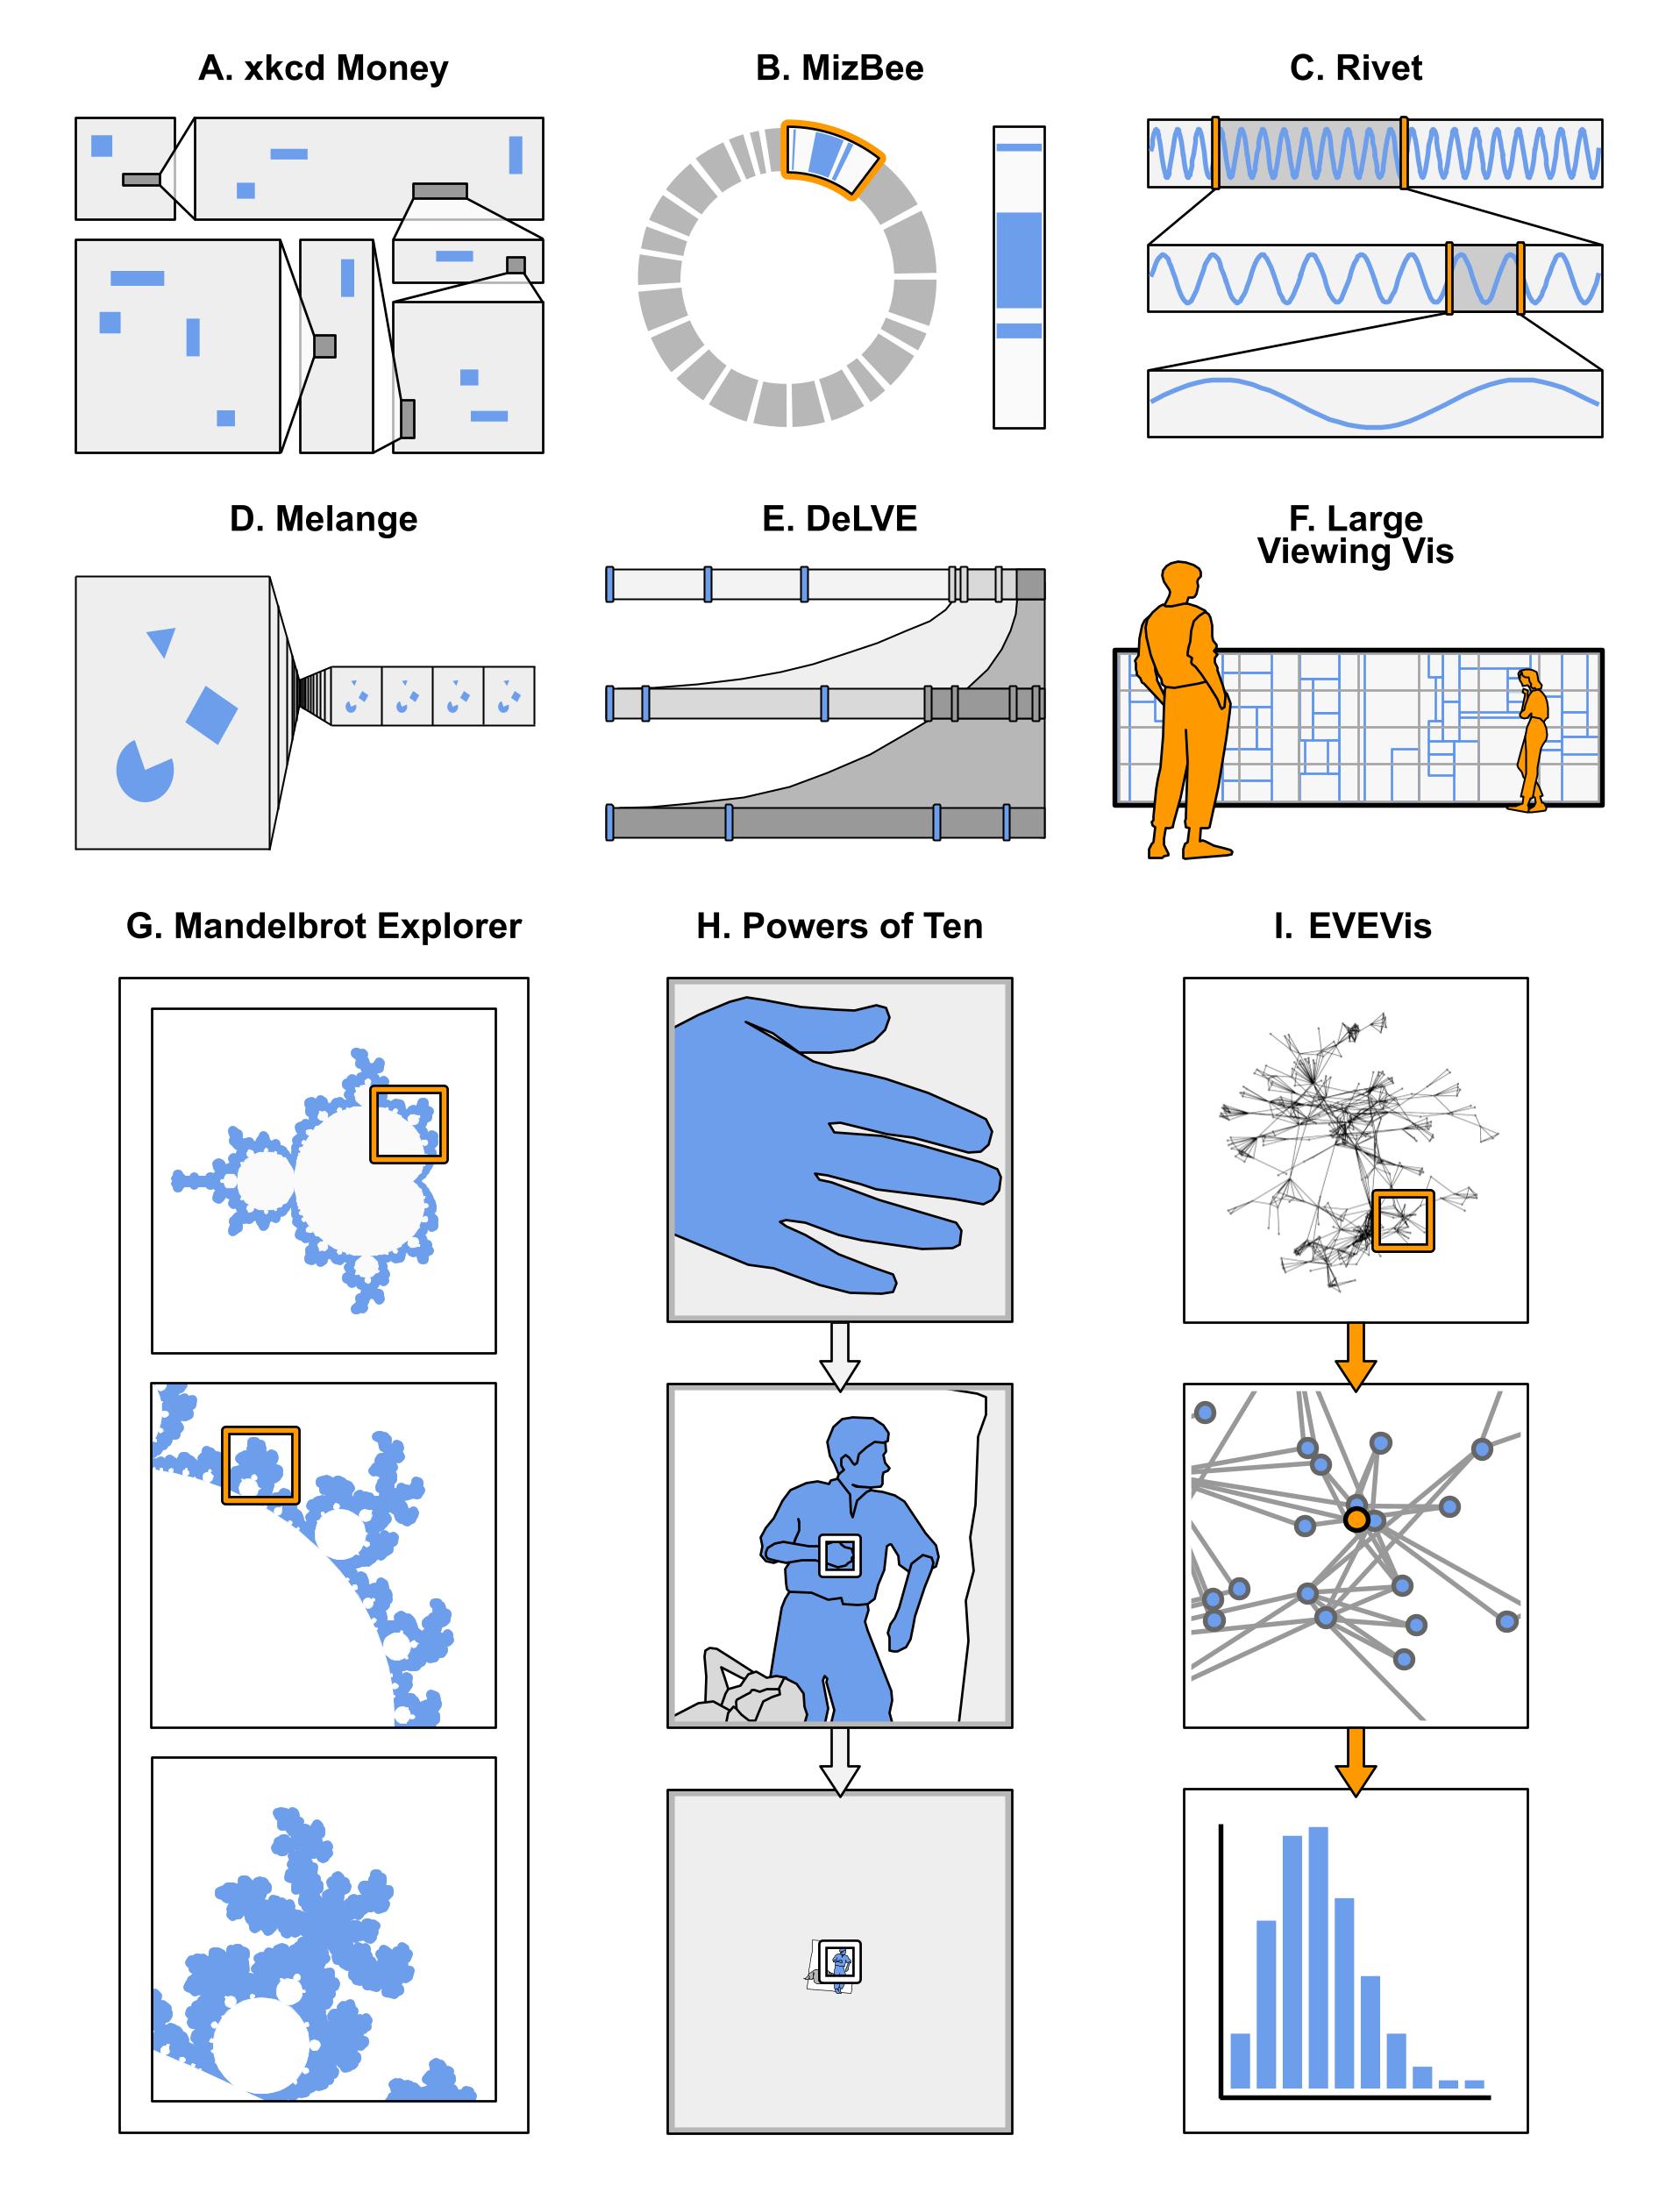
Designing multiscale visualizations, particularly when the ratio between the largest scale and the smallest item is large, can be challenging, and designers have developed many approaches to overcome this challenge. We present a design space for visualization with multiple scales. The design space includes three dimensions, with eight total subdimensions. We demonstrate its descriptive power by using it to code approaches from a corpus we compiled of 52 examples, created by a mix of academics and practitioners. We demonstrate descriptive power by analyzing and partitioning these examples into four high-level strategies for designing multiscale visualizations, which are shared approaches with respect to design space dimension choices. We demonstrate generative power by analyzing missed opportunities within the corpus of examples, identified through analysis of the design space, where we note how certain examples could have benefited from different choices. We discuss patterns in the use of different dimension and strategy choices in the different visualization contexts of analysis and presentation.
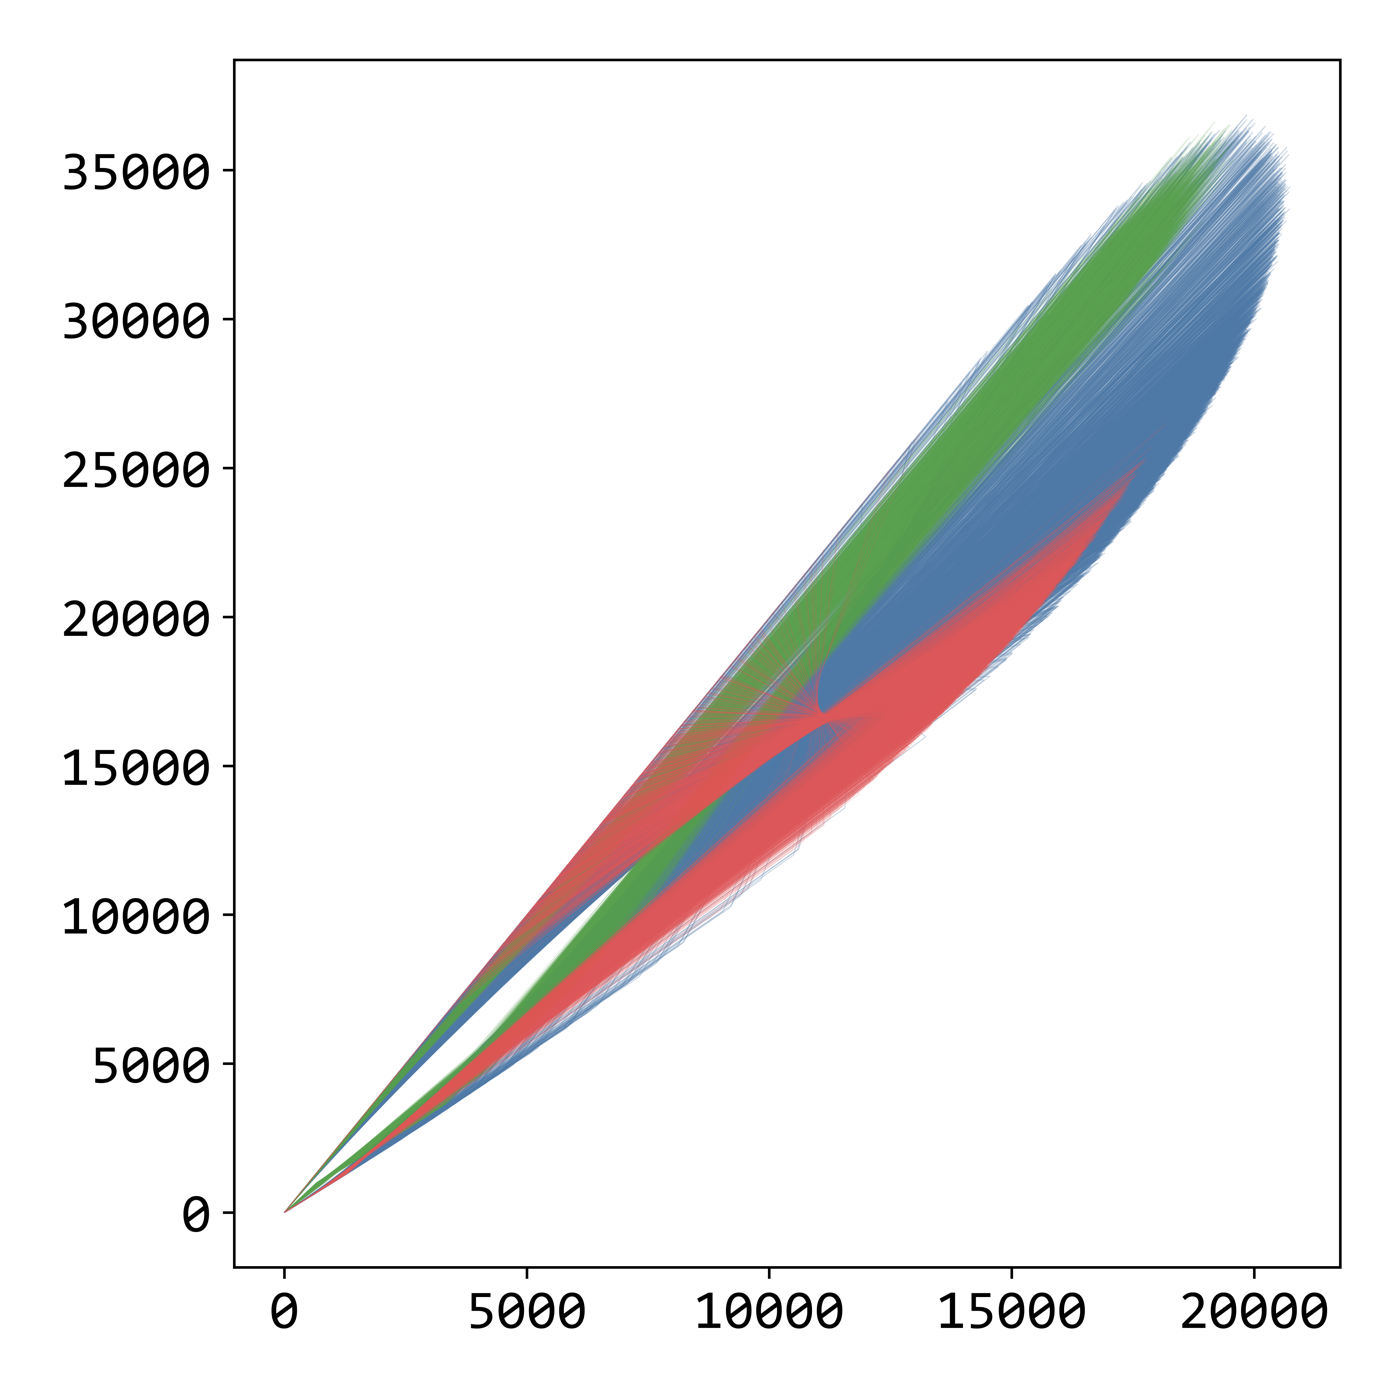
An ‘invariant descriptor’ captures meaningful structural features of networks, useful where traditional visualizations, like node-link views, face challenges like the ‘hairball phenomenon’ (inscrutable overlap of points and lines). Designing invariant descriptors involves balancing abstraction and information retention, as richer data summaries demand more storage and computational resources. Building on prior work, chiefly the BMatrix—a matrix descriptor visualized as the invariant ‘network portrait’ heatmap—we introduce BFS-Census, a new algorithm computing our Census data structures: Census-Node, Census-Edge, and Census-Stub. Our experiments show Census-Stub, which focuses on ‘stubs’ (half-edges), has orders of magnitude greater discerning power (ability to tell non-isomorphic graphs apart) than any other descriptor in this study, without a difficult trade-off: the substantial increase in resolution doesn’t come at a commensurate cost in storage space or computation power. We also present new visualizations—our Hop-Census polylines and Census-Census trajectories—and evaluate them using real-world graphs, including a sensitivity analysis that shows graph topology change maps to visual Census change.
Path & Service
- 2016 BSc Biology The University of British Columbia Irving K. Barber Faculty of Science International Major Entrance Scholarship (IMES)
- 2019 MSc Earth Science The University of British Columbia Faculty of Science, Department of Earth, Ocean and Atmospheric Sciences
- 2027 PhD Computer Science The University of British Columbia Faculty of Science, Department of Computer Science Four Year Doctoral Fellowship (4YF)
CSGSA President
Represented graduate students across research, teaching, and community life as president of the Computer Science Graduate Student Association (CSGSA), which promotes the academic, mental, and social welfare of all MSc and PhD students, with representatives across all major department committees.
Graduate Teaching Assistant
For CPSC 103 ‘Introduction to Systematic Program Design’ and DSCI 320 ‘Visualization for Data Science’.
3MT Lead
Organized and led UBC Computer Science's inaugural participation in the university-wide Three-Minute Thesis (3MT) competition; current event host.
Scientific Illustration

Drag to exploreSwipe to explore


Mural Plan


Contact
Fun fact: Walking is my primary method of transportation. Walking affords deep thinking time, cardio, and locomotion -- win win win!