#024 - CHS vs LIDAR low tide
Shown in the figure below is the sonar-based bathymetry of Burrard Inlet from the CHS elevation dataset. The blue color has an vertical limit at 0 meters, which yields a spatial XY pattern that matches CHS contour shapefiles at 0 meter elevation (the white line), a pseudo-confirmation that this low tide mark is the true “lowest tide” vertical slice. Pseudo-confirmation because both may derive from the same data, but are independent products so we can treat them as independent lines of evidence. It’s important to note that bathymetric points below this Z value, or all the blue regions, are perpetually underwater.
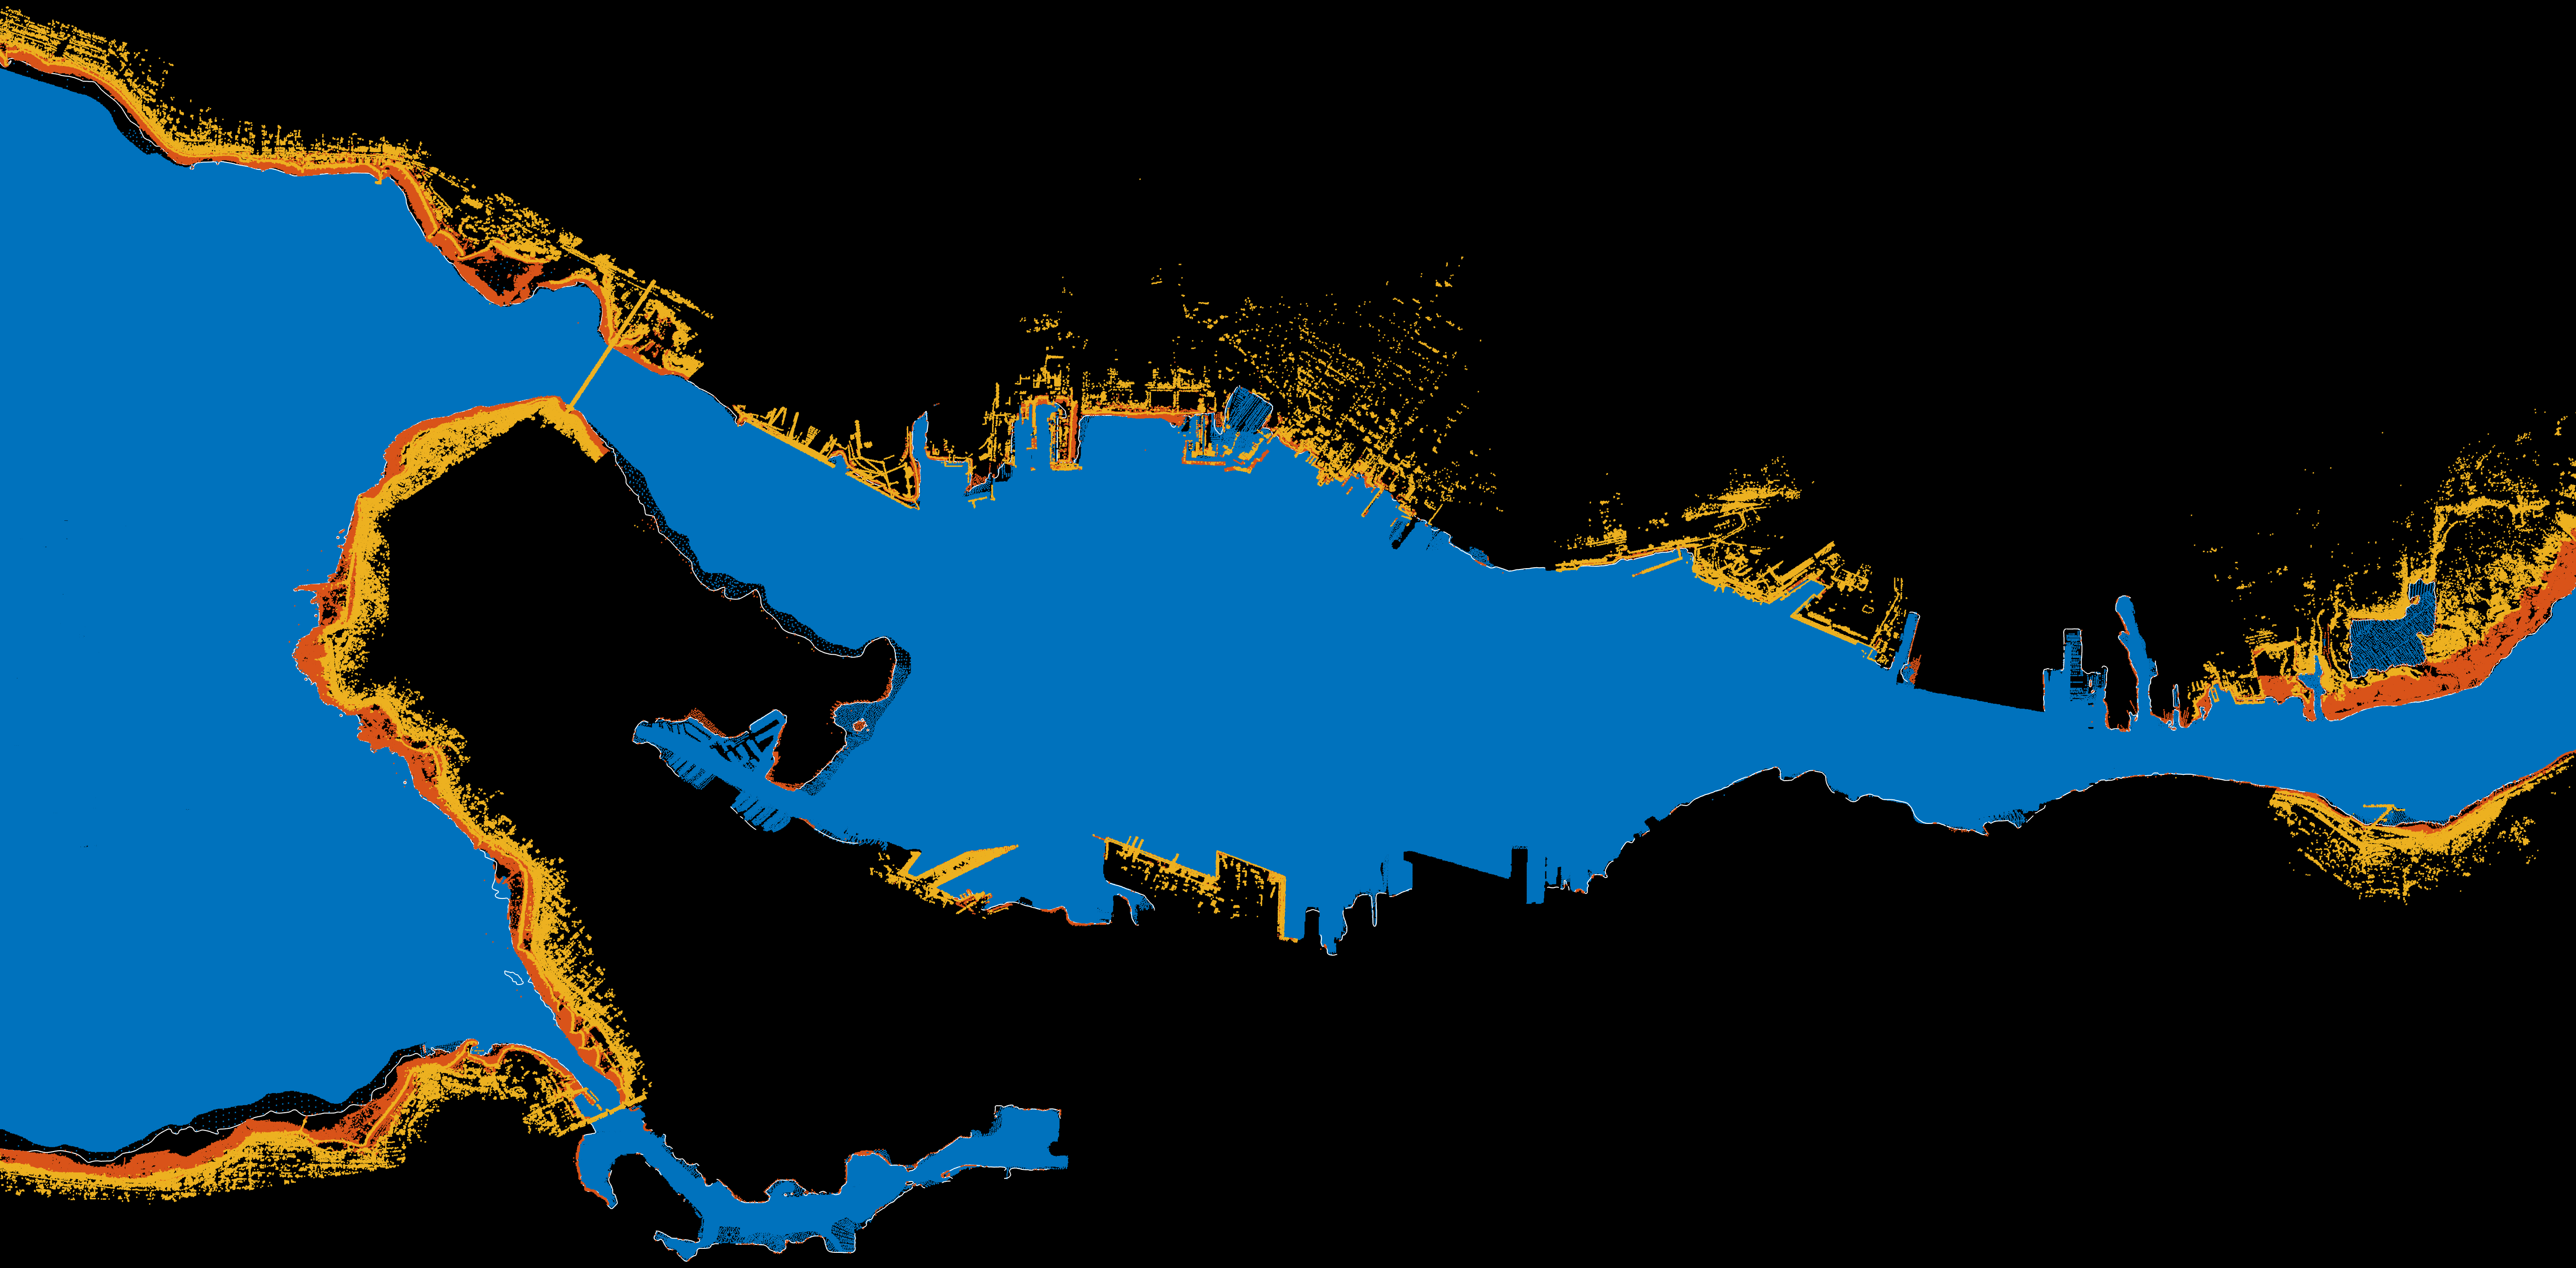
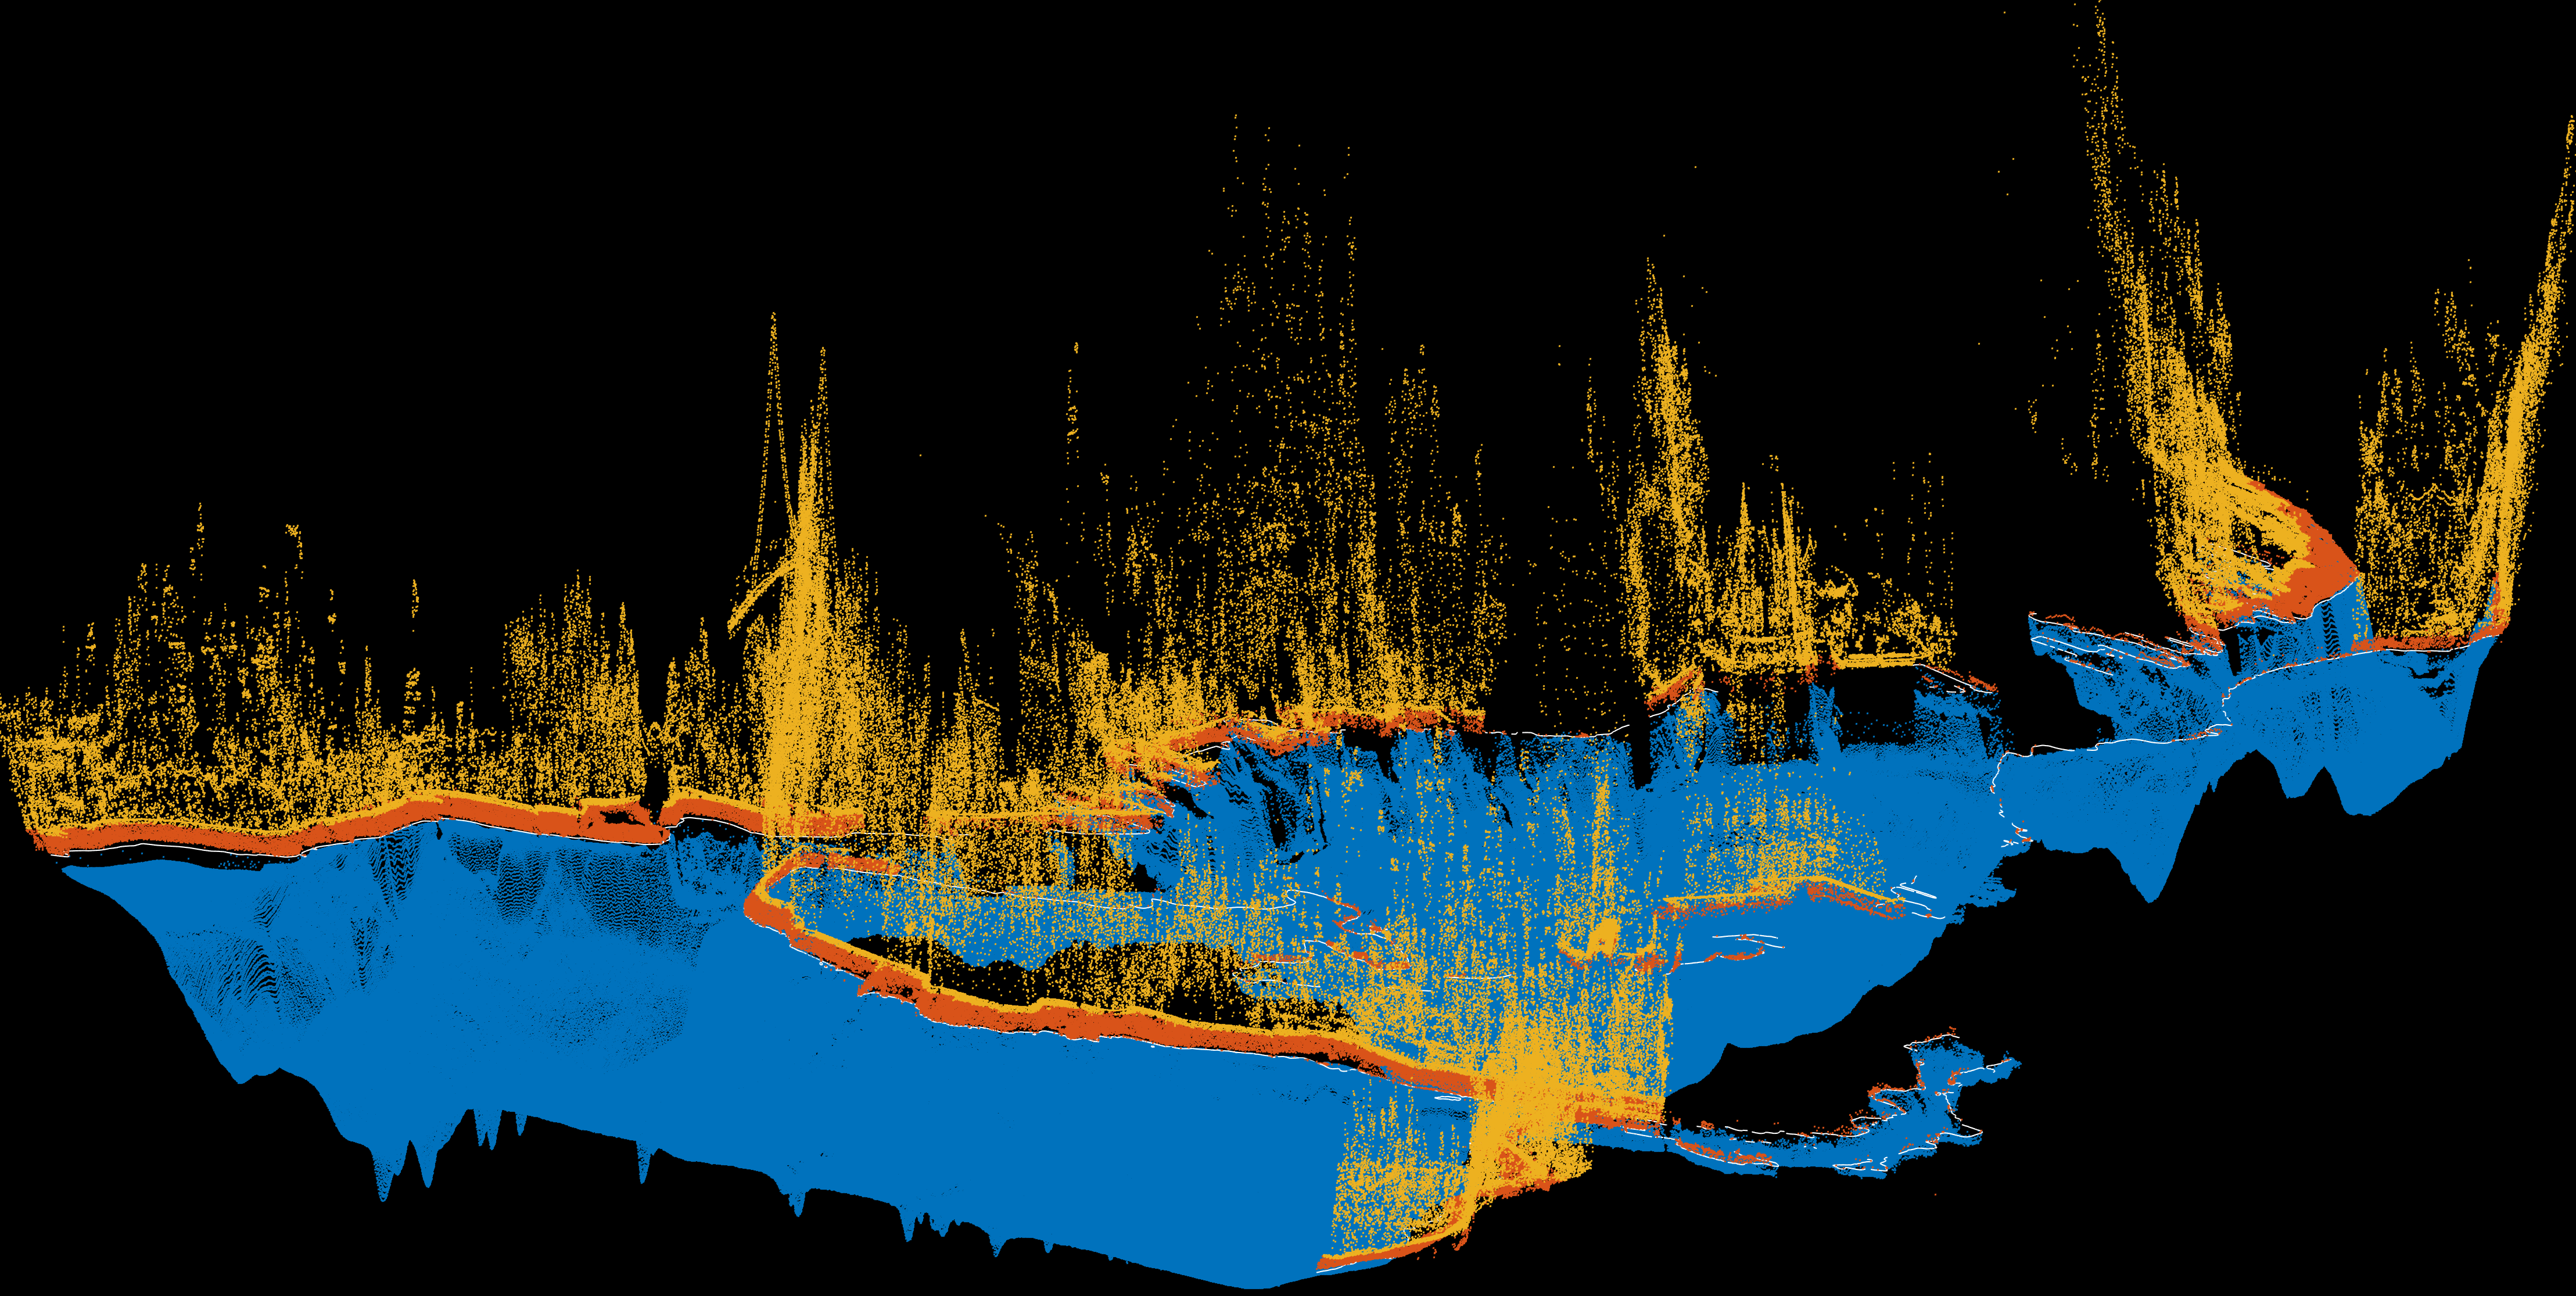
This is all fine, except that we are also interested in the features of intertidal bathymetry, which are above the 0 meter line, and can extend up to the 4th meter and even 6th meter mark (the high water mark is not a consistent elevation slice, but a jittery phenomenon that arises from differential hydrodynamics).
The CHS bathymetry dataset has some capriciously scattered data that fills the intertidal habitat, even extending well into the city in some regions. To differentiate these data, in the figure above in orange are points between 0 meters and 4 meters, so orange is the “intertidal region” (the true intertidal requires the high water mark, which as explained before, is not an elevation slice). Yellow points are all remaining data above 4 meters, so we can confidently say its dry land. EDIT: In closer inspection, the truly scattered data begins at exactly 5 meters and above, with the 0 meter to 5 meter band holding quality intertidal data.
Both orange and yellow points are above-low-tide, but sadly their presence is inconsistent across the CHS dataset. It would be wise to leave them out altogether. However, the few regions where they are present do express interesting just-above-water bathymetry, which should be captured, especially in regions where the intertidal surface is extensive.
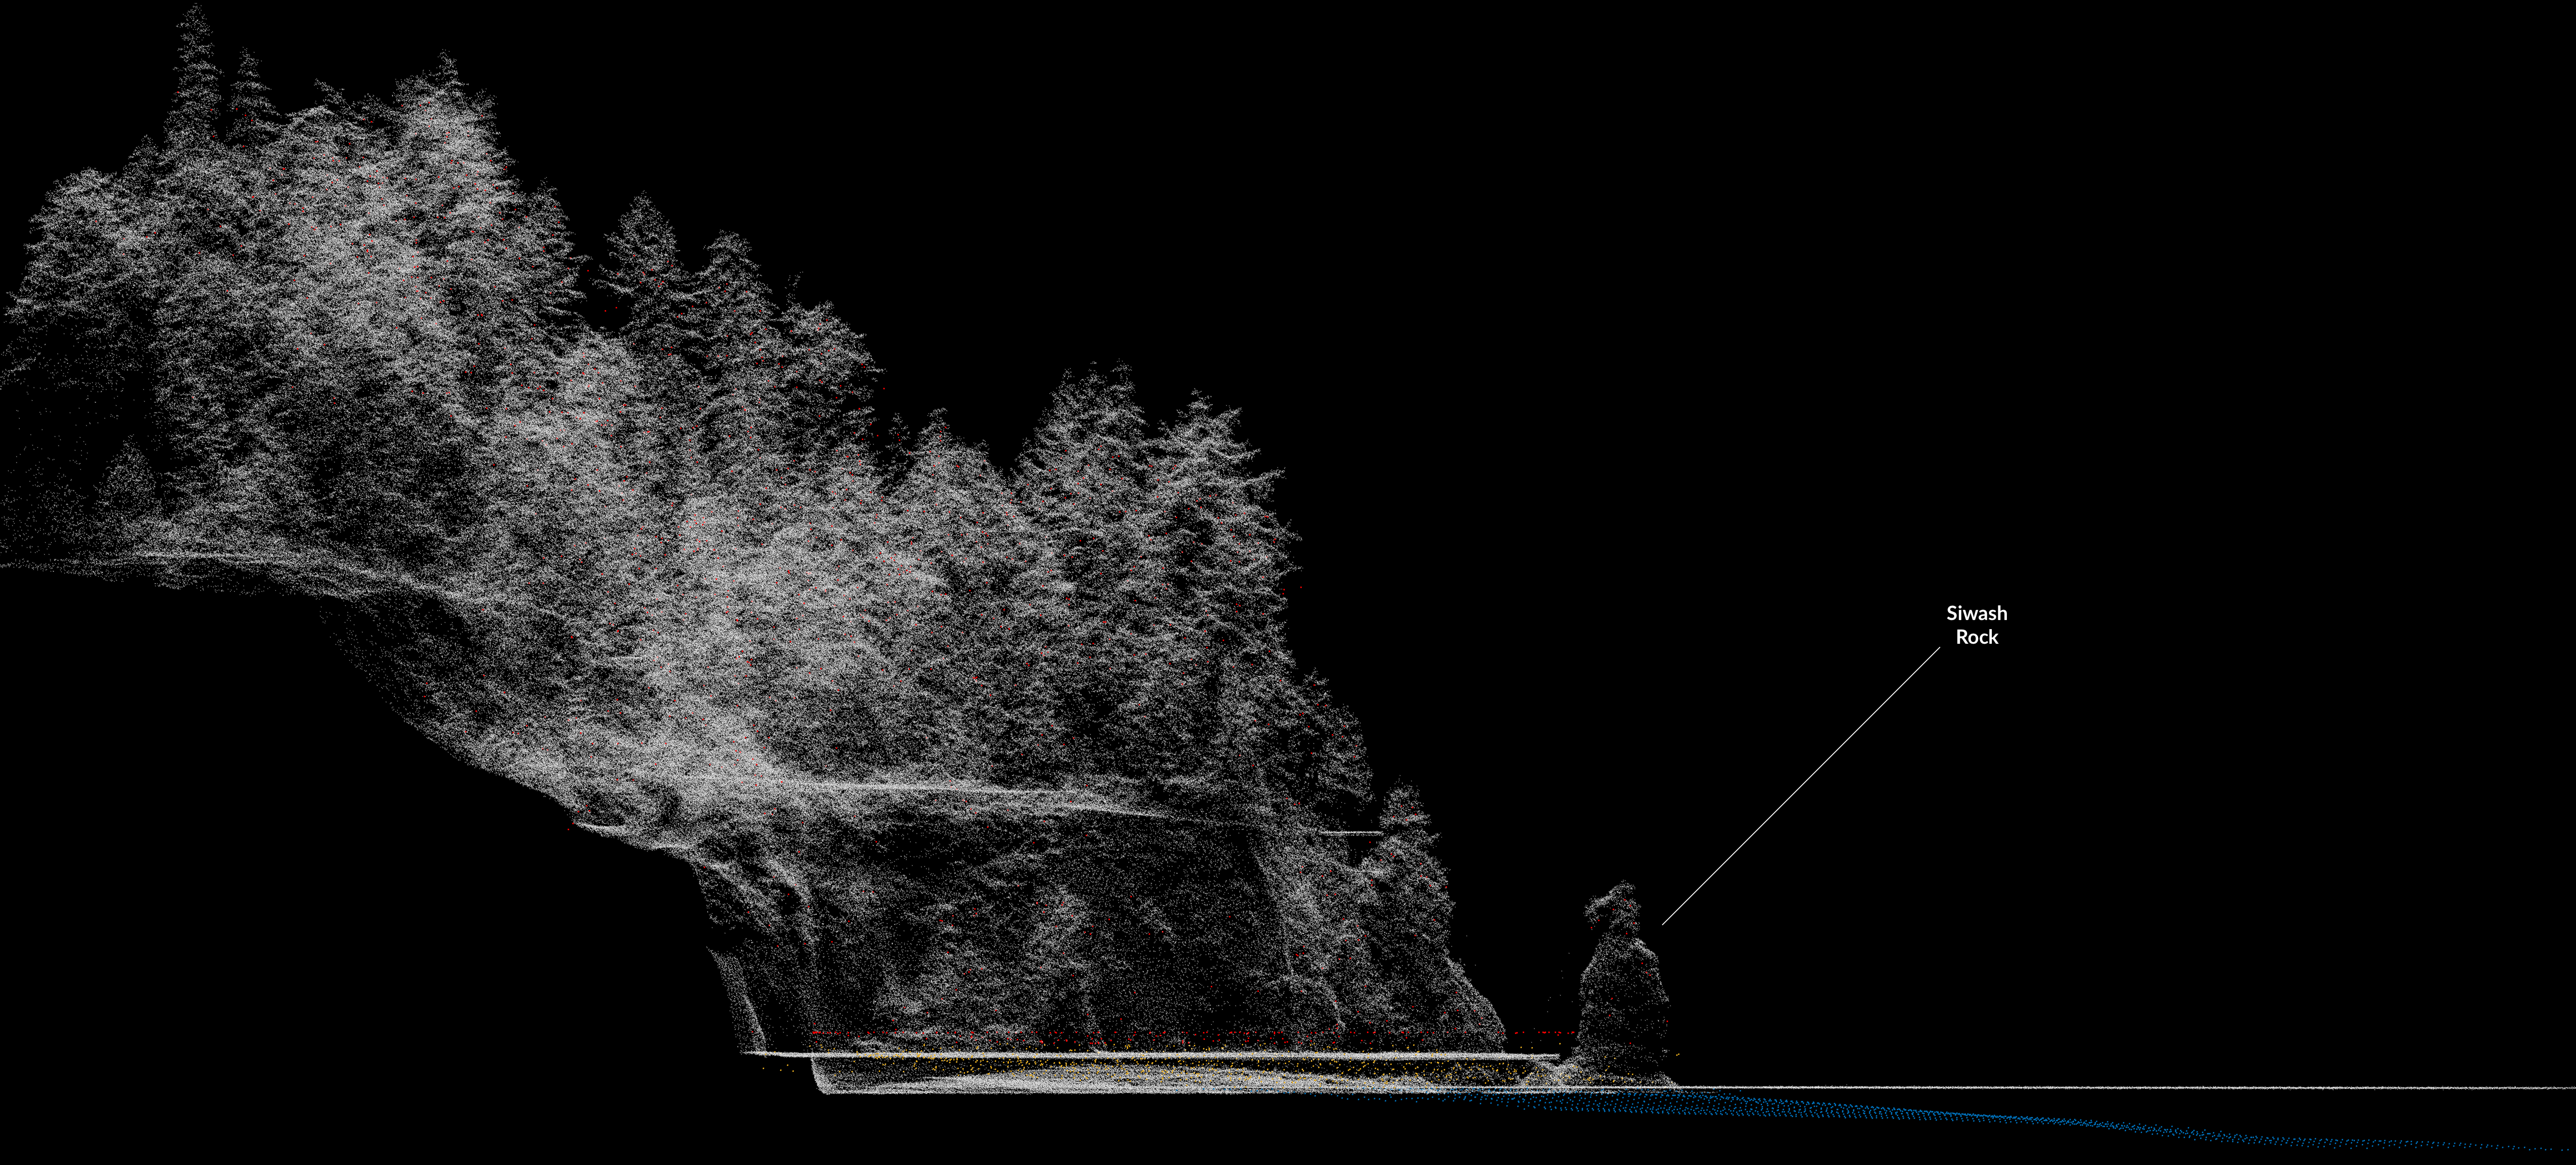
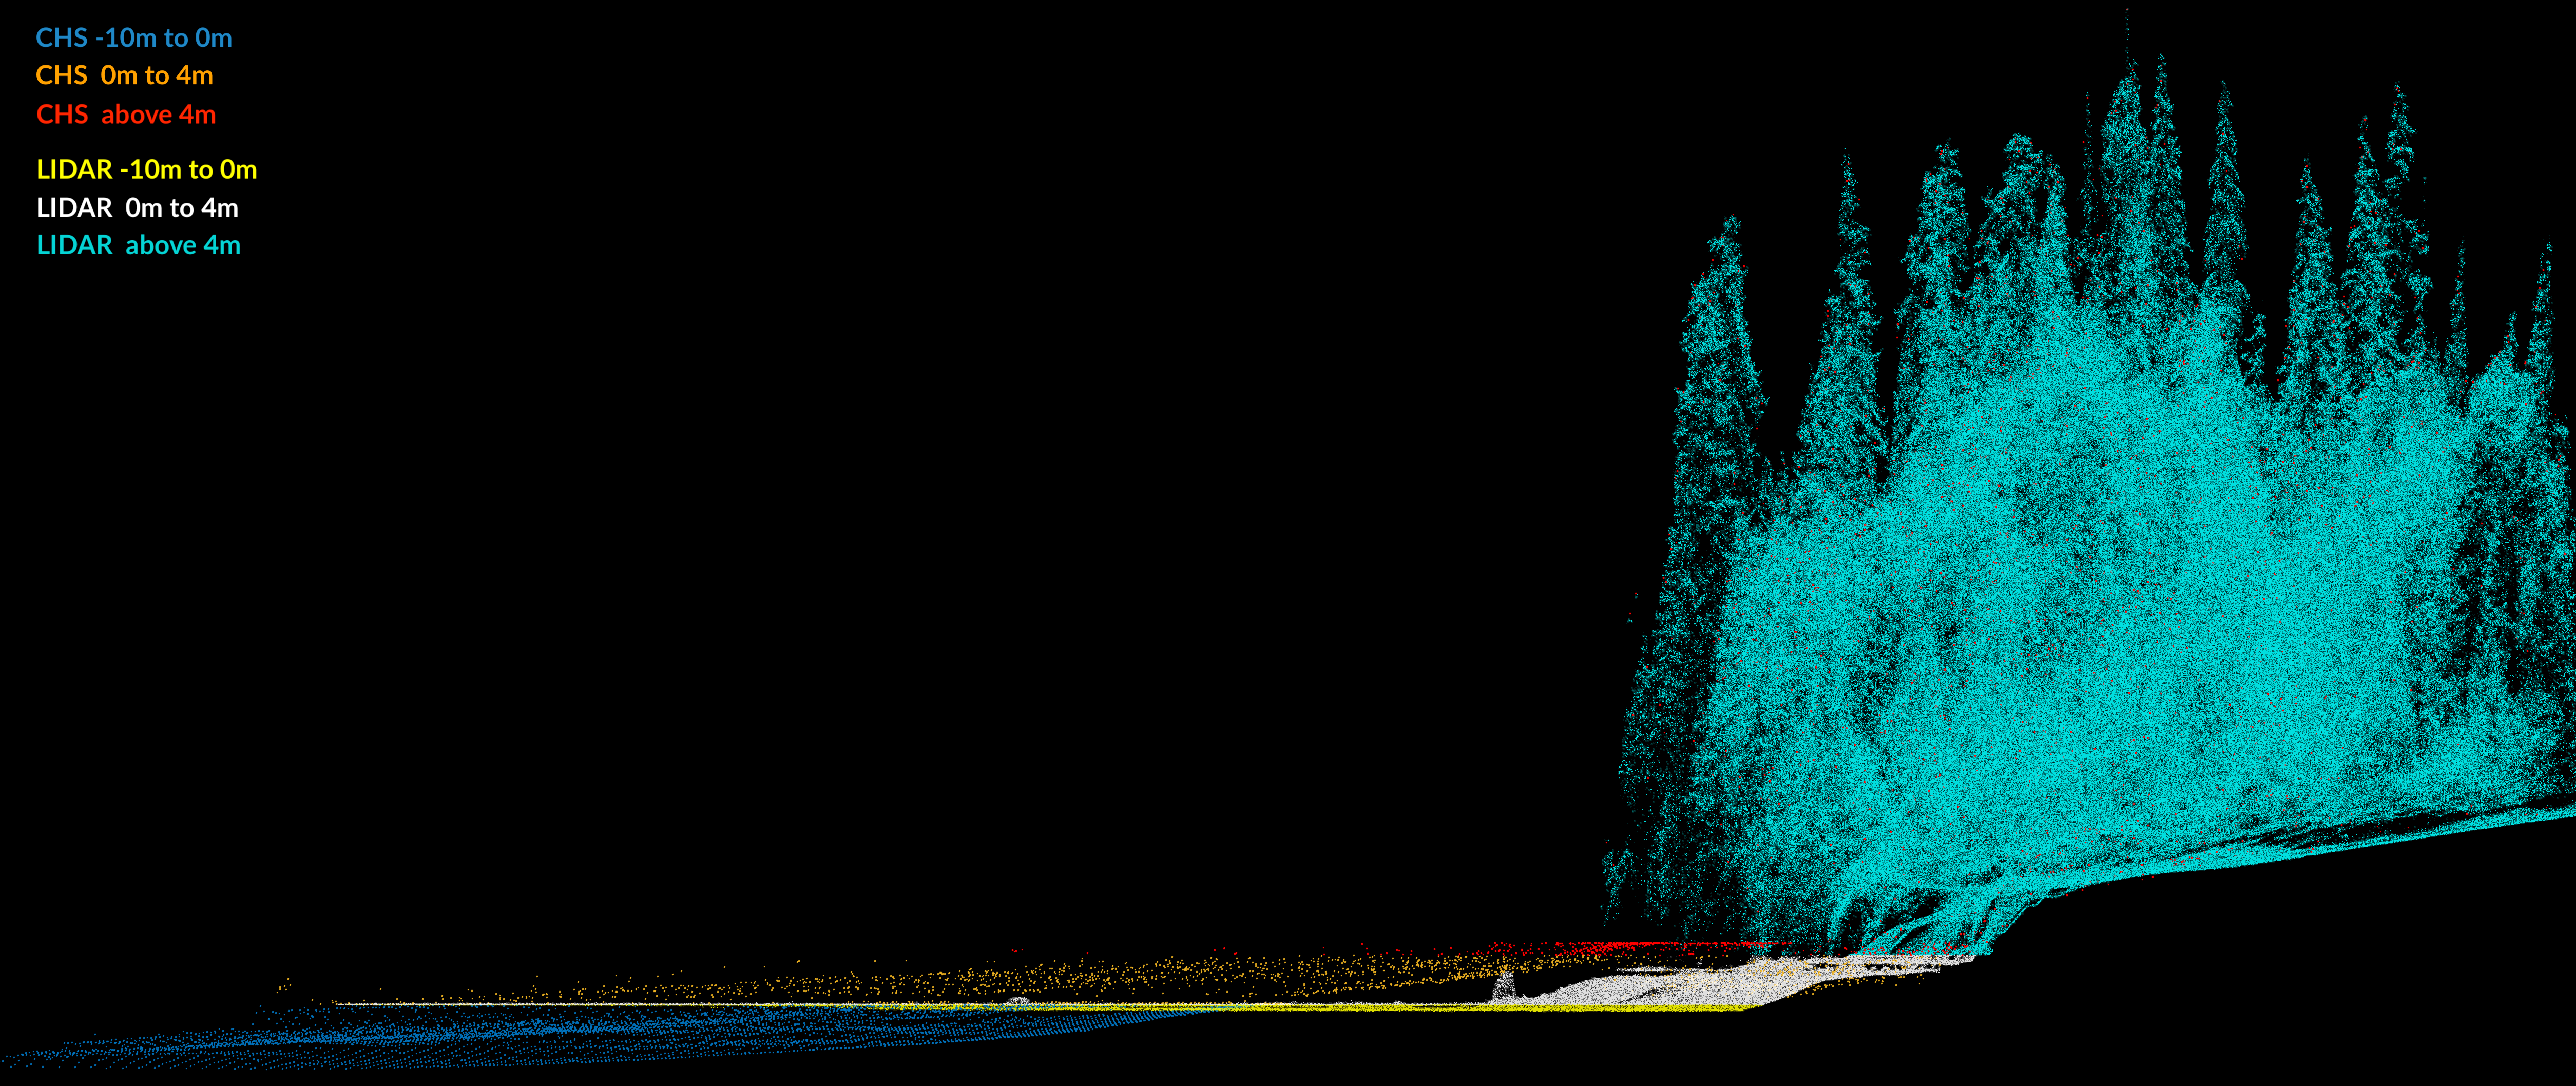
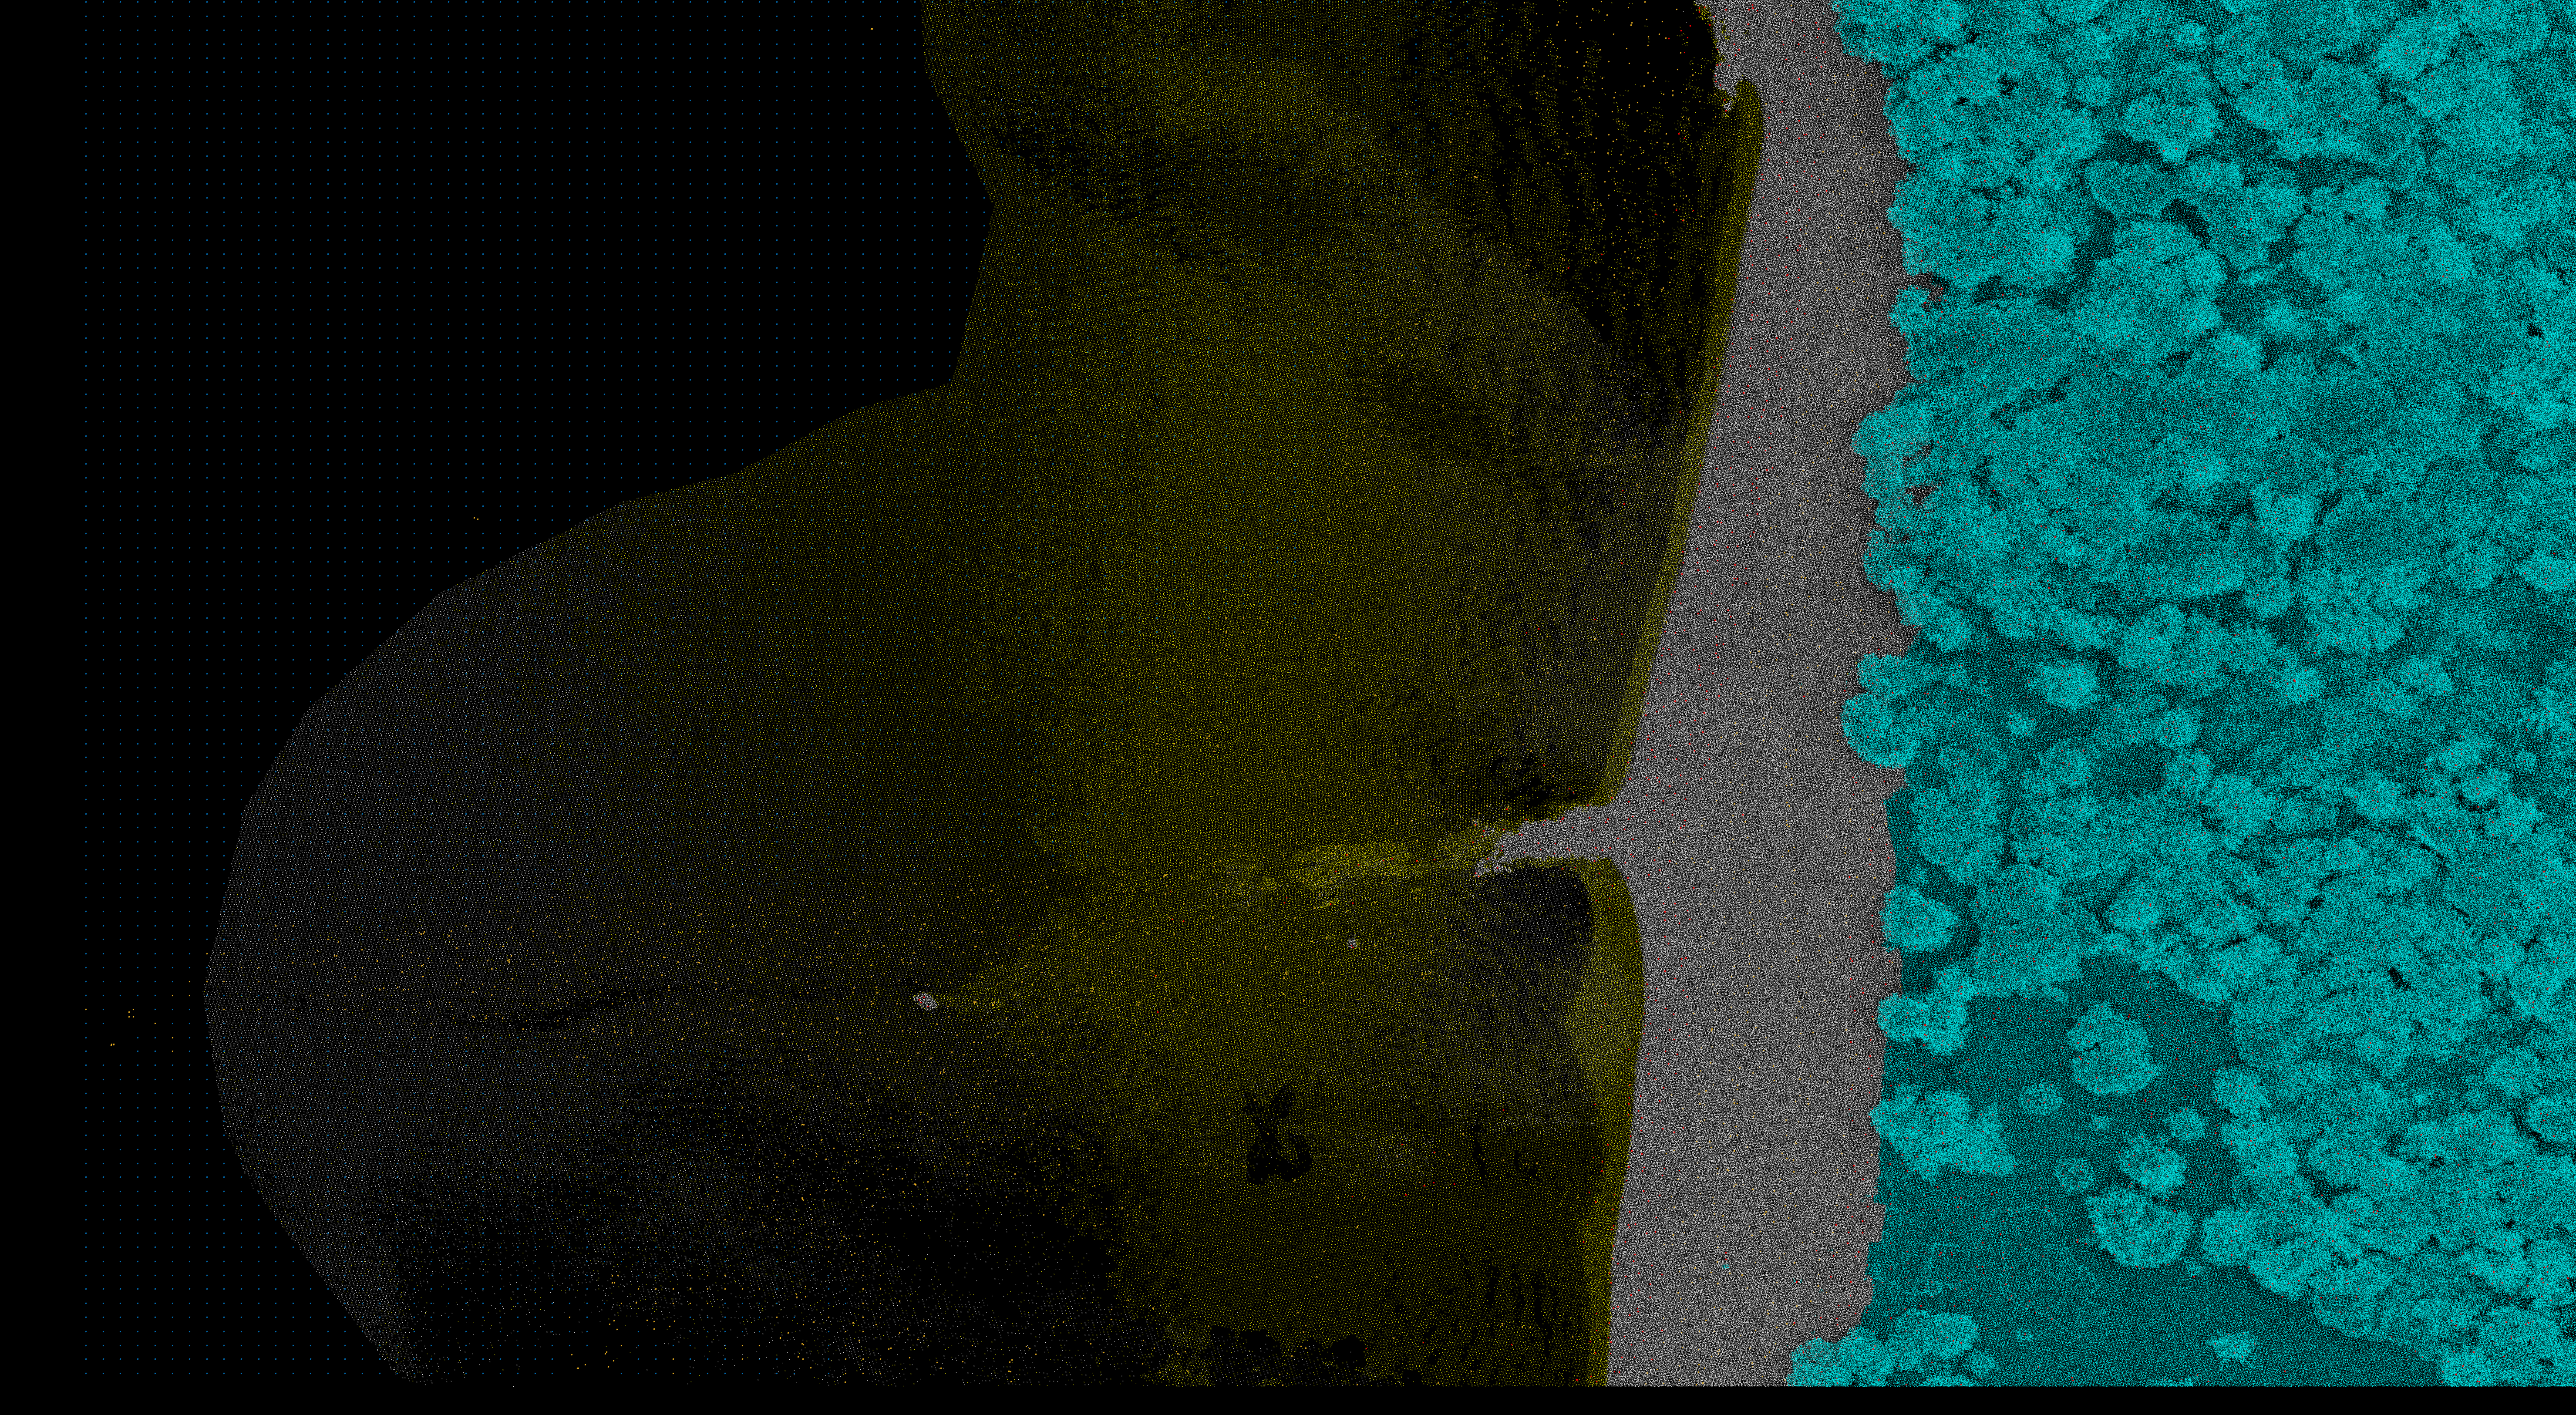
The problem: these CHS bathymetry data do not match an independent City of Vancouver LIDAR dataset. Shown below is a close-up of the seawall at Siwash Rock and Third Beach. In both instances the LIDAR seawall is at 2.78 meters above the 0 meter line, while the CHS seawall hovers about 2 meters above, at 4.88 meters. Even stranger, the scattered “dry land” points (in red below for Siwash Rock LIDAR, orange everywhere else) do match the tree canopy of Stanley Park.
This is quite strange. One solution would be to “sink” the complete CHS bathymetry so that both seawalls match, but then the CHS 0 meter line will become -2 meters, unrealistically narrowing the intertidal region. Conversely, the LIDAR dataset could be “lifted” 2 meters, but this is unwise because of the sheer accuracy and quality of the gigantic LIDAR dataset: it is very trustworthy, down to the centimeter scale!
A compromise could be to extract CHS intertidal points and “rescale” them to force all hovering features to be bound between 0 and 4 meters, preserving their interestingness (where present). Doing nothing is also an option, cutting off both CHS and LIDAR at 0 meters and letting the interpolant fill the interim “intertidal” region. The big problem with this: the intertidal surface becomes featureless and gradientless, a synthetic fabrication of the intertidal habitat.
What to do??? (not a rhetorical question, I actually don’t know what to do)