#020 - Contours from 3D elevation
The following method converts 3D elevation data into constant-elevation line contours, in this case from -10 meters to +10 meters in intervals of 1 meter, for a total of 21 contours (including the sea level line, at 0 meters). After loading the XYZ data, we need the non-repeating indices of X and Y, and their respective vector lengths, in order to reshape the elevation values of the Z vector, and populate an array matrix with this Z data.
Next is the forloop, which runs 21 times, each run for a depth. The contour function stores X and Y line data in the M vector by default, we add a third column with the respective depth value. This is useful to visualize these lines in 3D later.
A nested forloop extracts indices of line break instances, and replaces these with not-a-number values, the [NaN,NaN,NaN] string. Finally, the M vector is saved in CSV format, with the name of the file conctated from the main forloop instance depth value.
X=readmatrix('BurrardInletModelX_Longitude.csv');
Y=readmatrix('BurrardInletModelY_Latitude.csv');
Z=readmatrix('BurrardInletModelZ_Elevation.csv');

X=unique(X);nx=length(X);
Y=unique(Y);ny=length(Y);
array=reshape(Z,ny,nx);

for d=1:1:21

    depth=d-11;

    [M,c]=contour(X,Y,array,[depth,depth]);M=M';

    index=find(M(:,1)==depth);
    elev=ones(length(M),1).*depth;
    M=cat(2,M,elev);

    for i=1:length(index)
        q=index(i);
        M(q,:)=[NaN,NaN,NaN];
    end

    string=strcat('ModelContour',num2str(depth),'m.csv');
    writematrix(M,string);

end
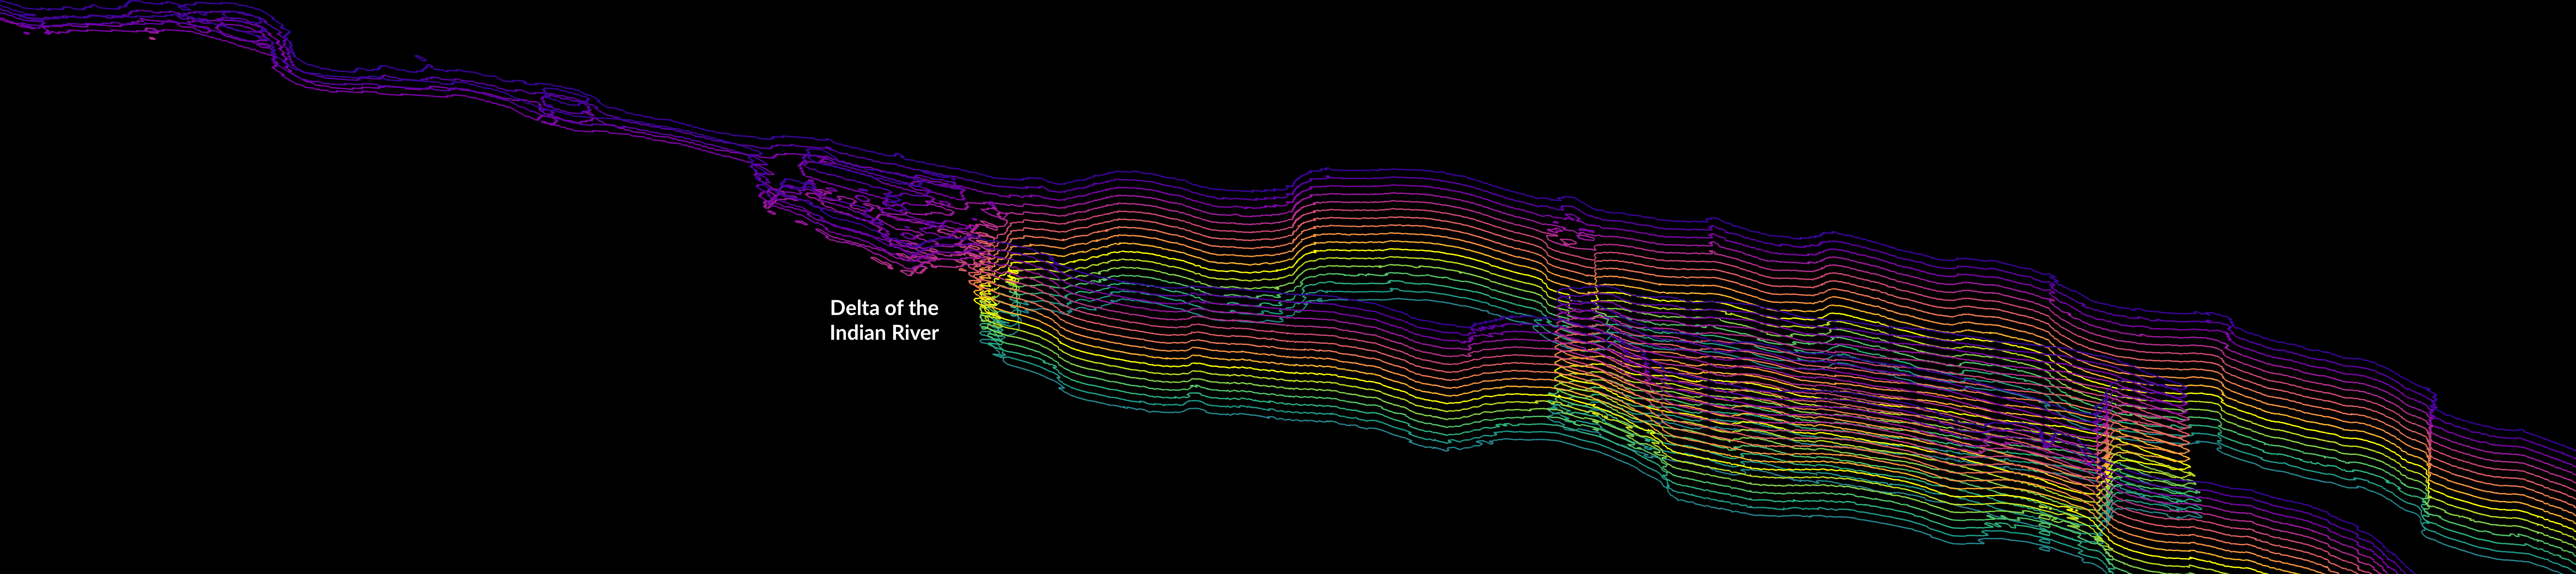
To visualize the result, we import each of the saved CSV vectors and convert them to variables. Then concatenate all of them into an XYZ vector Lines, which the figures below visualize.
Line10=readmatrix('ModelContour-10m.csv');
Line01=readmatrix('ModelContour-1m.csv');
Line02=readmatrix('ModelContour-2m.csv');
Line03=readmatrix('ModelContour-3m.csv');
Line04=readmatrix('ModelContour-4m.csv');
Line05=readmatrix('ModelContour-5m.csv');
Line06=readmatrix('ModelContour-6m.csv');
Line07=readmatrix('ModelContour-7m.csv');
Line08=readmatrix('ModelContour-8m.csv');
Line09=readmatrix('ModelContour-9m.csv');

Line00=readmatrix('ModelContour0m.csv');

Depth10=readmatrix('ModelContour10m.csv');
Depth01=readmatrix('ModelContour1m.csv');
Depth02=readmatrix('ModelContour2m.csv');
Depth03=readmatrix('ModelContour3m.csv');
Depth04=readmatrix('ModelContour4m.csv');
Depth05=readmatrix('ModelContour5m.csv');
Depth06=readmatrix('ModelContour6m.csv');
Depth07=readmatrix('ModelContour7m.csv');
Depth08=readmatrix('ModelContour8m.csv');
Depth09=readmatrix('ModelContour9m.csv');

Lines=cat(1,Depth01,Depth02,Depth03,Depth04,Depth05,Depth06,Depth07, ...
  Depth08,Depth09,Depth10,Line00,Line01,Line02,Line03,Line04,Line05, ...
  Line06,Line07,Line08,Line09,Line10);

figure('Position',[10,10,1420,780],'Resize','off','Color','k');
plot3(Lines(:,1),Lines(:,2),(Lines(:,3)+11));
for i=49.2625:0.0125:49.3375
    yline(i,'-w',num2str(i),'LineWidth',0.025);
end
for i=-123.175:0.0125:-122.975
    xline(i,'-w',num2str(i),'LineWidth',0.025);
end
xlim([-123.175,-122.975]);ylim([49.2625,49.3375]);
axis off;view(0,90);