
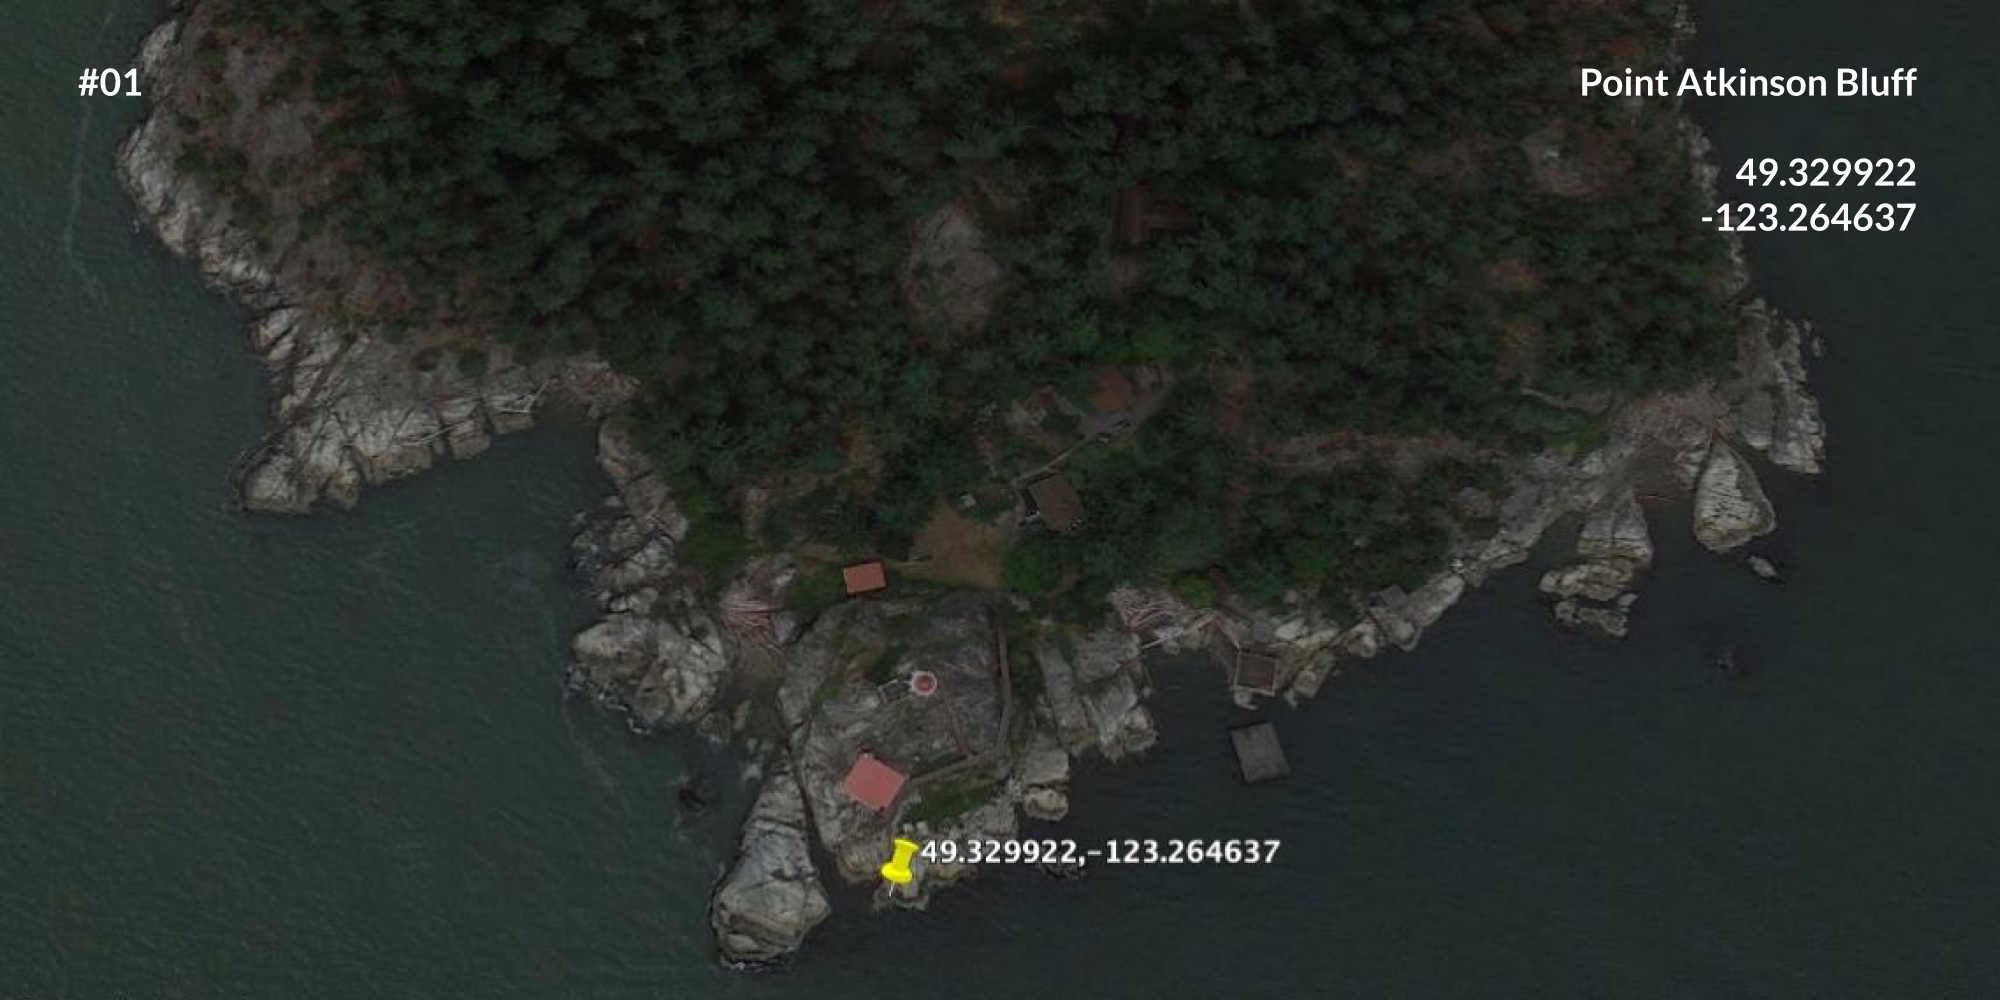
#013 - Control points
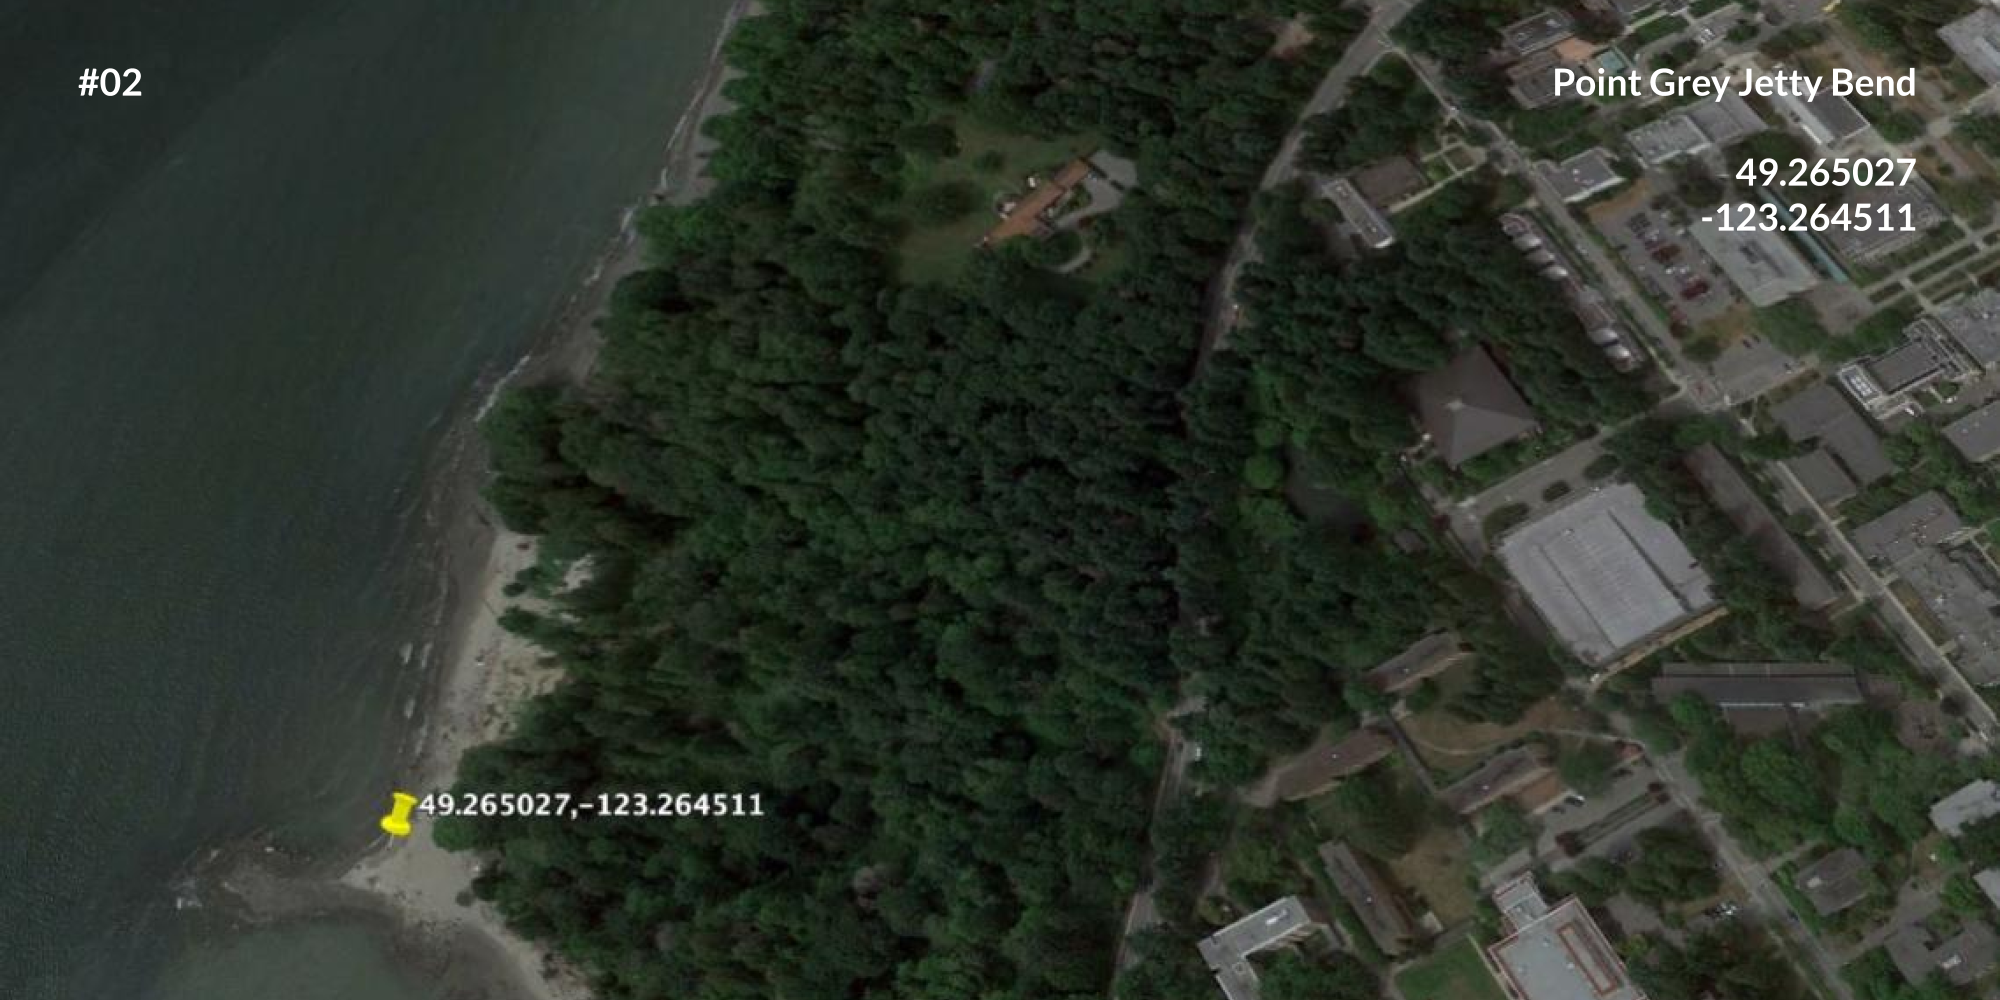
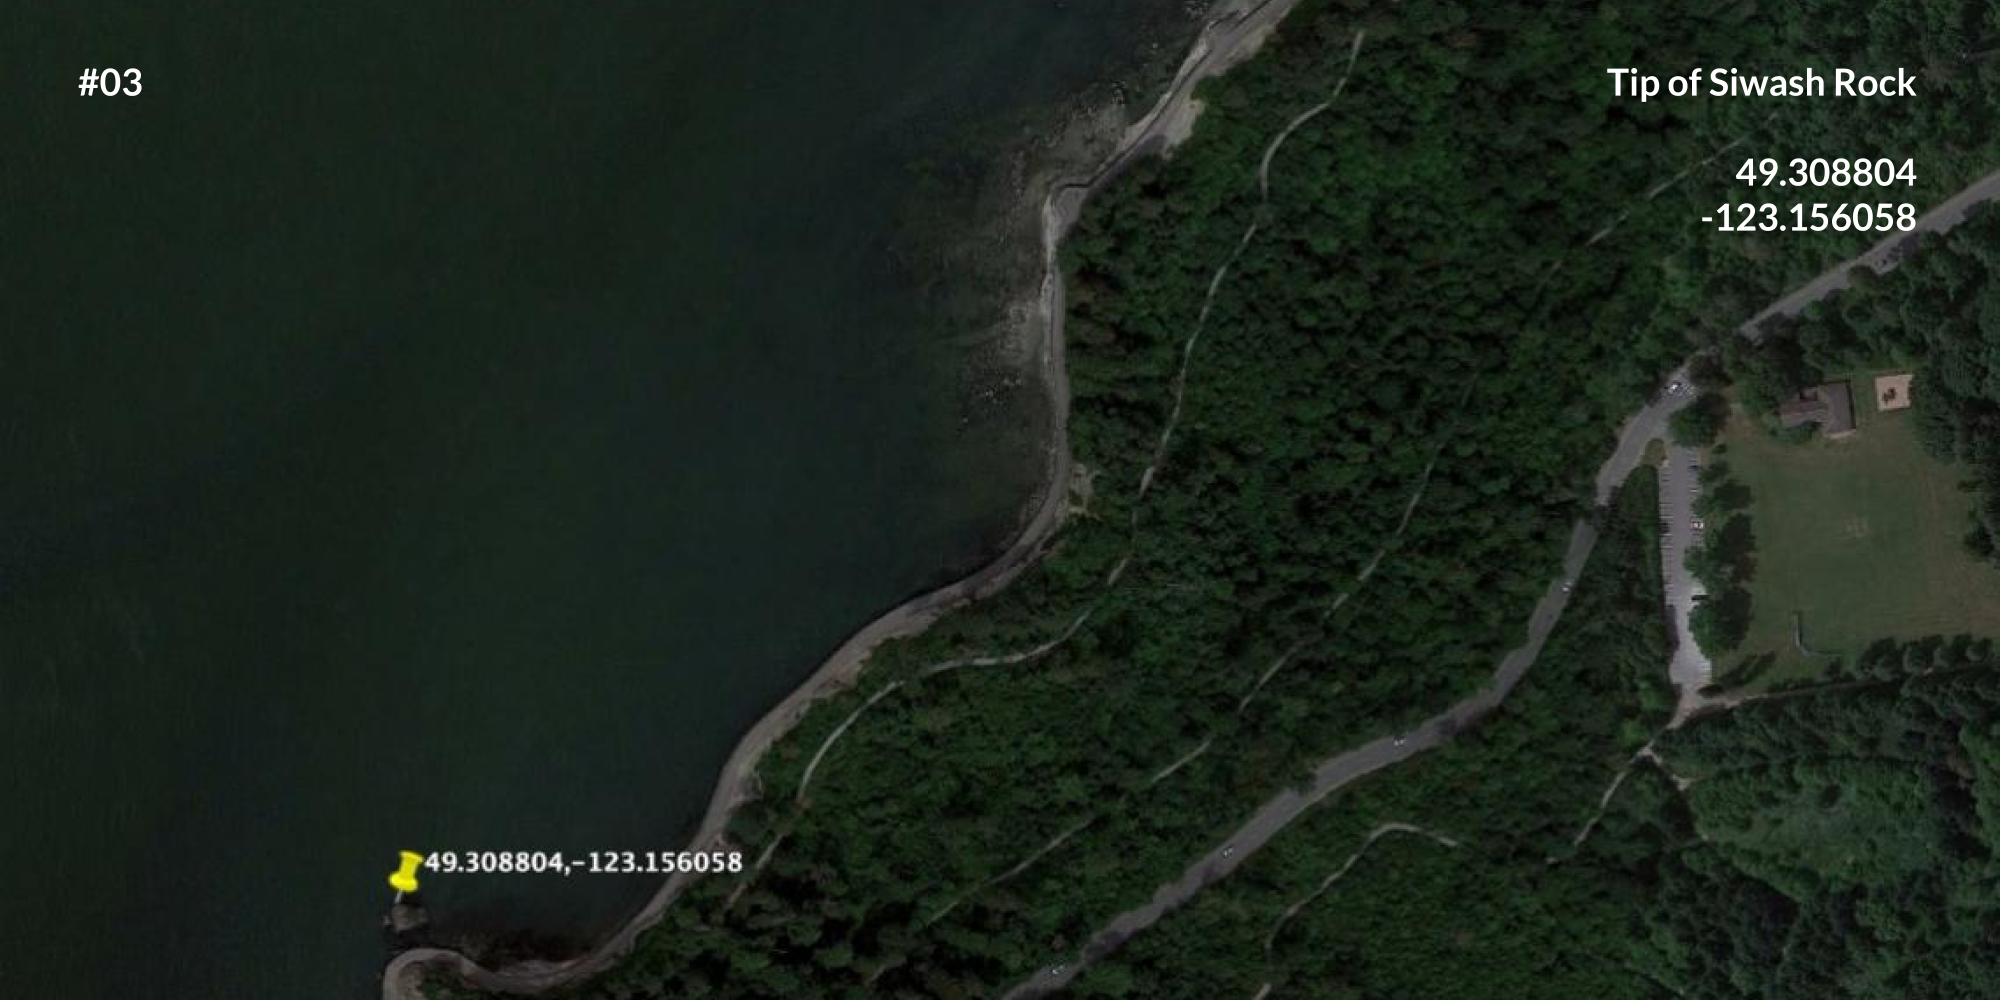
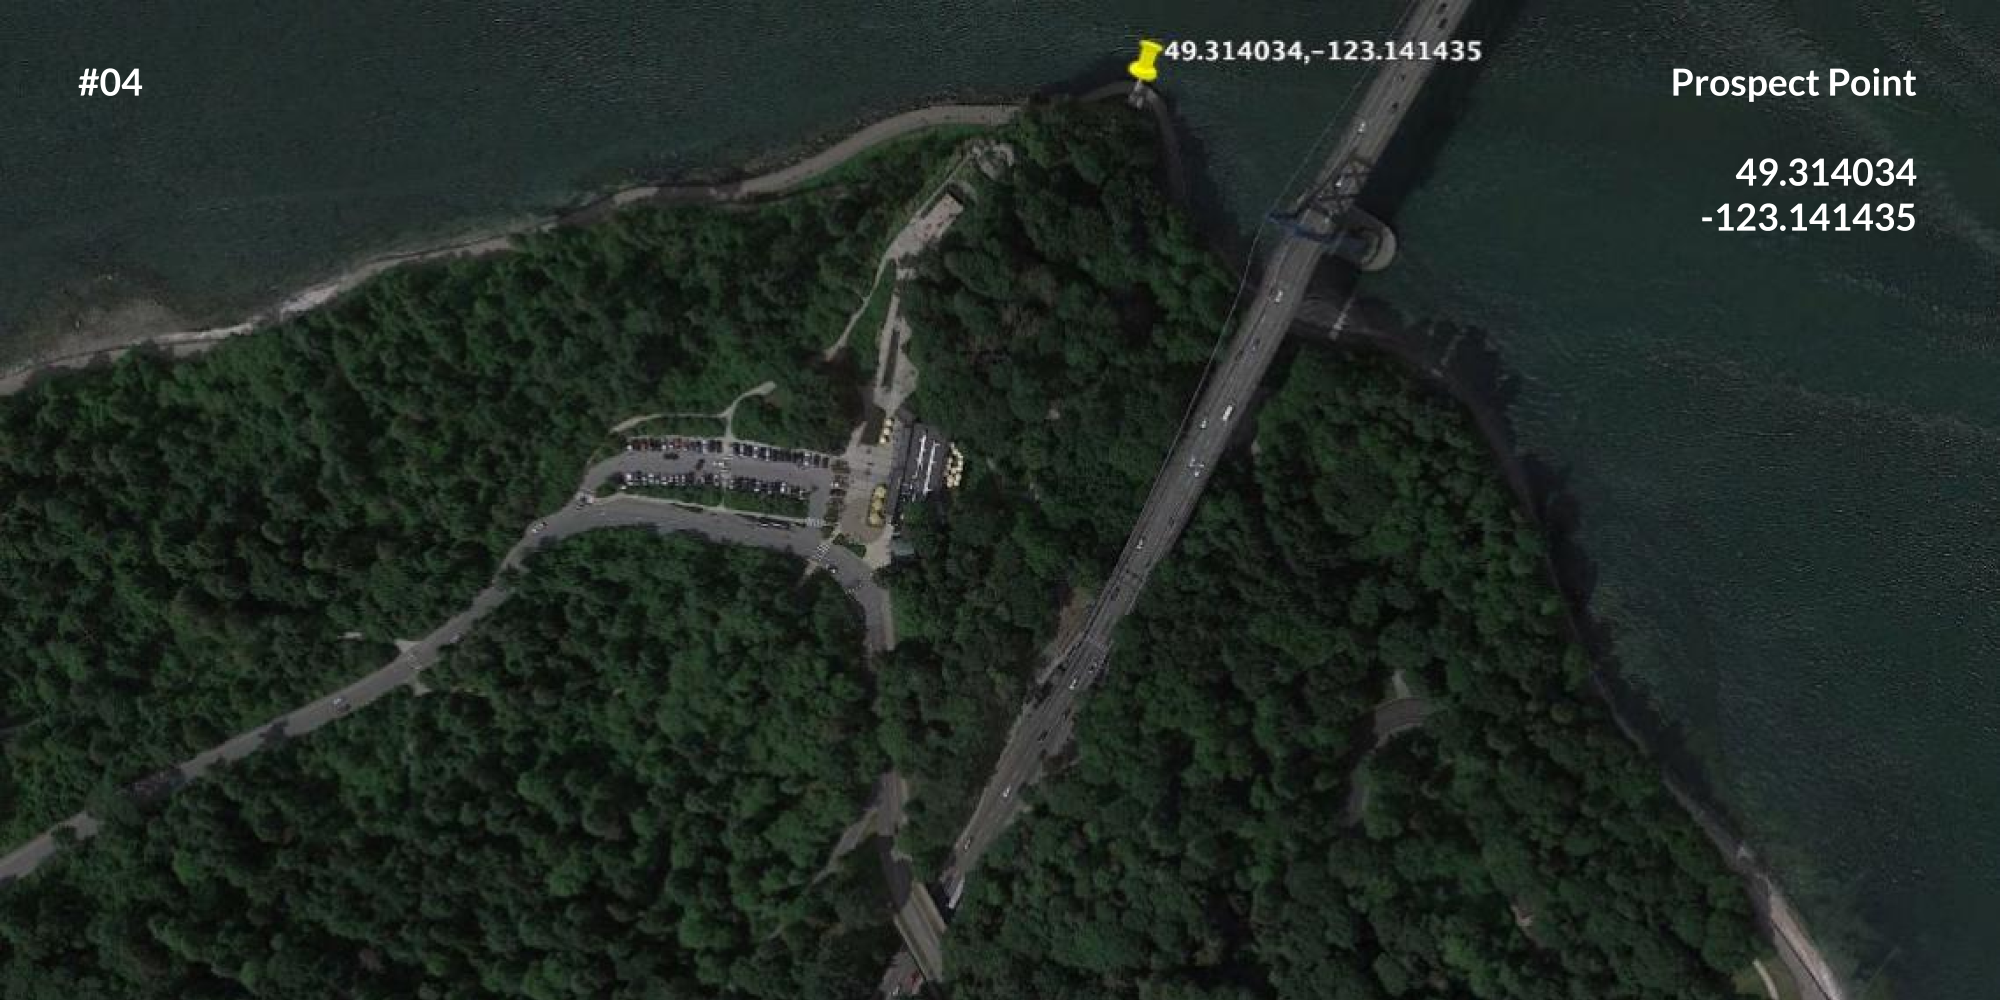
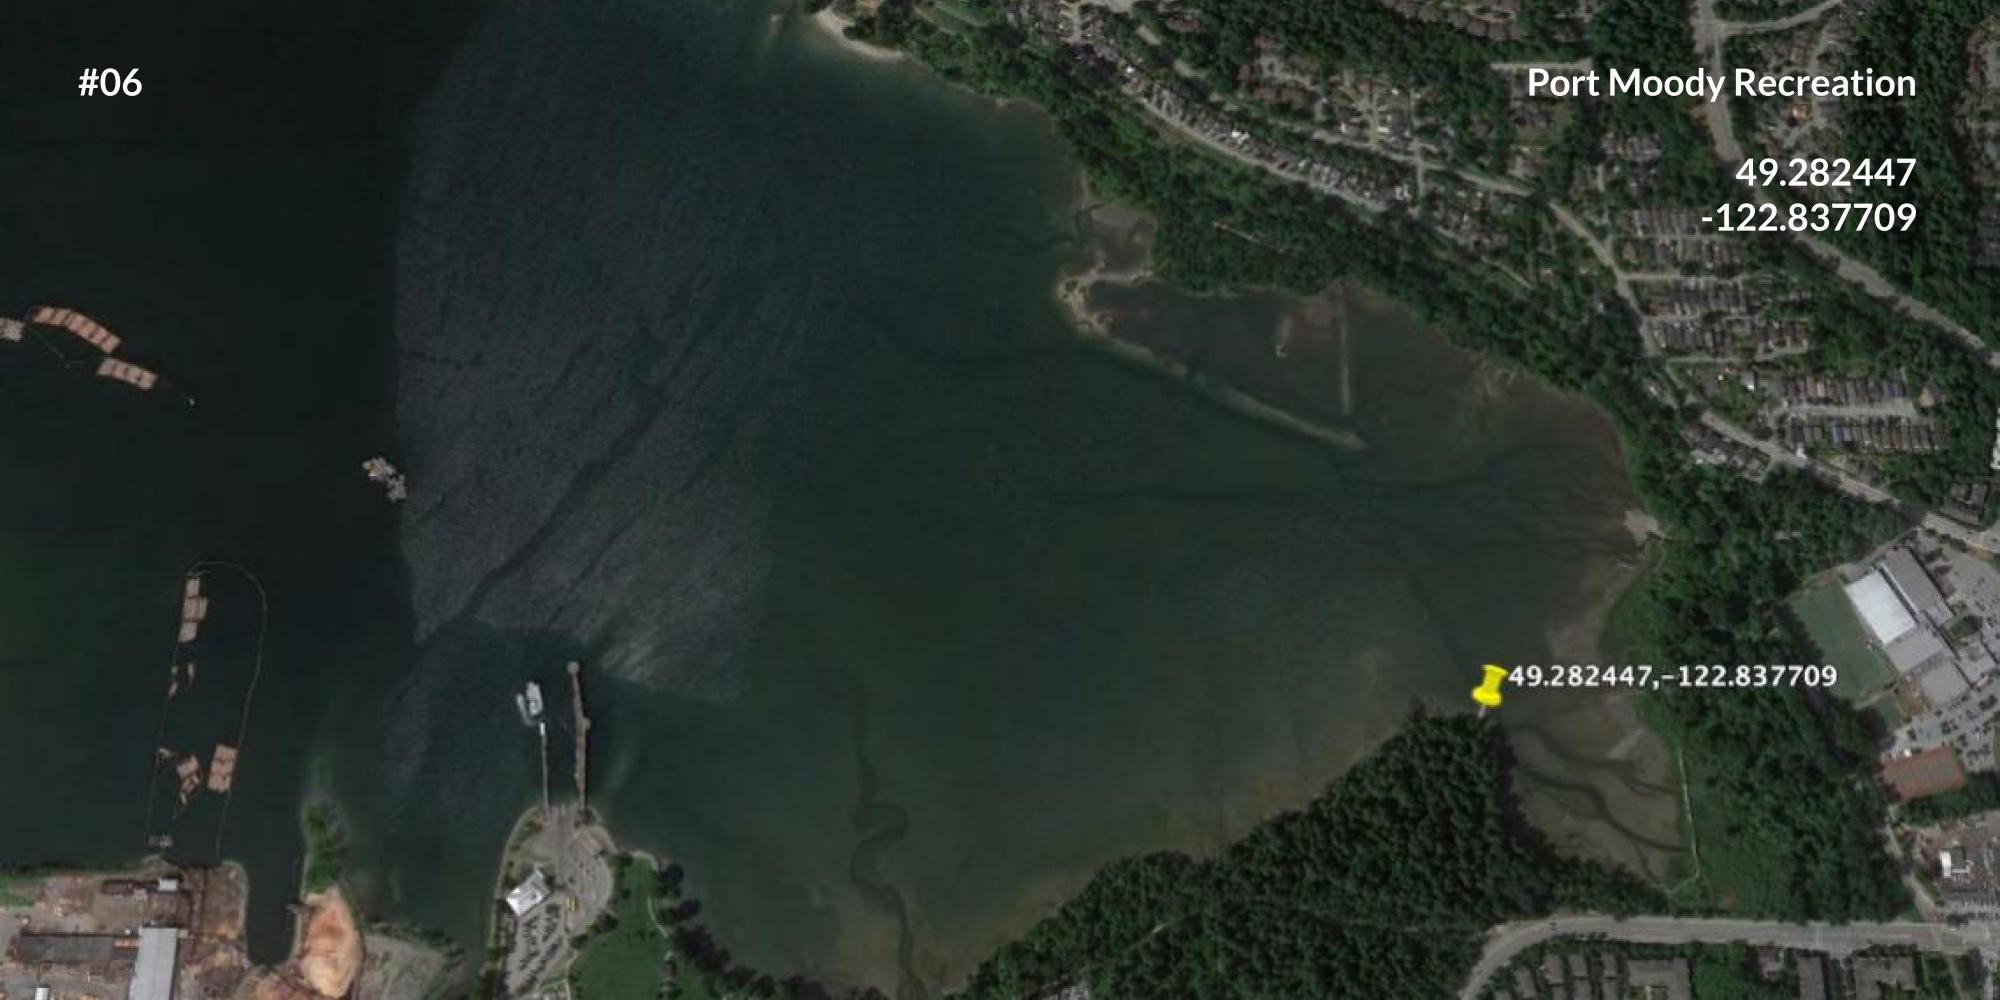
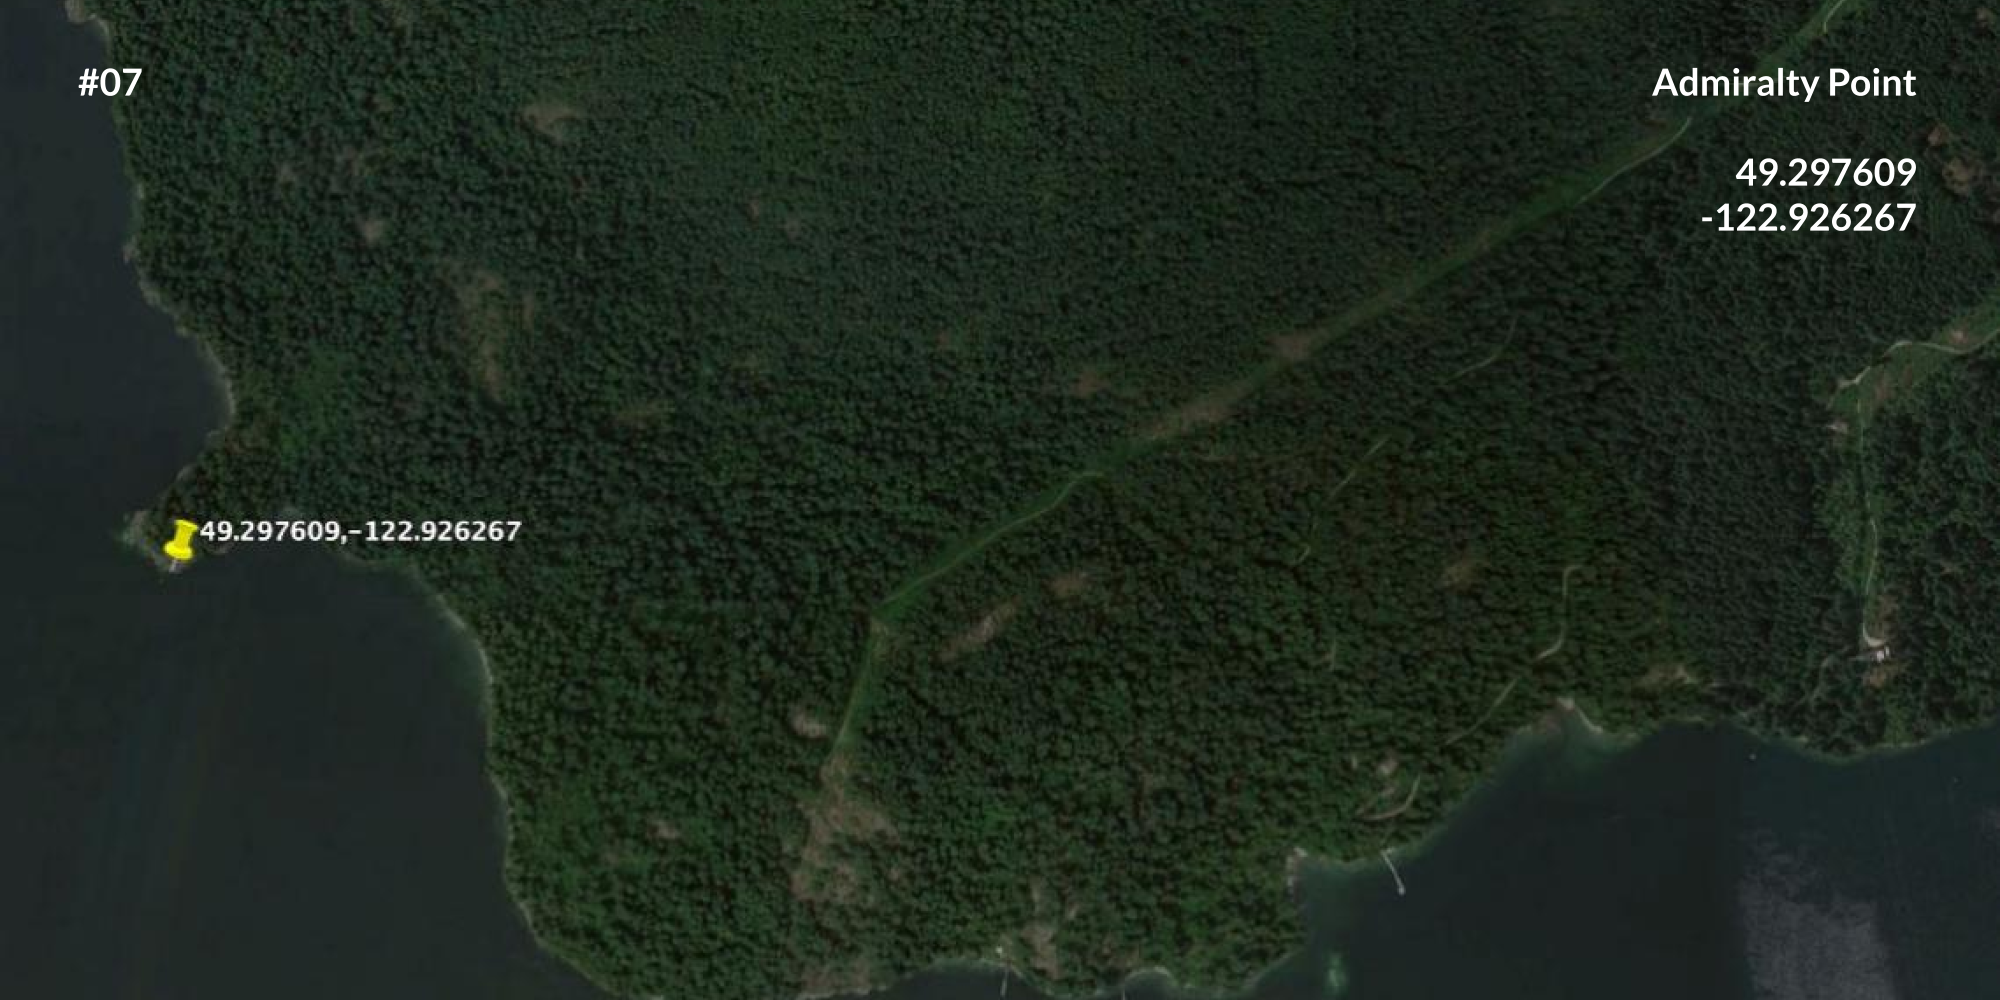
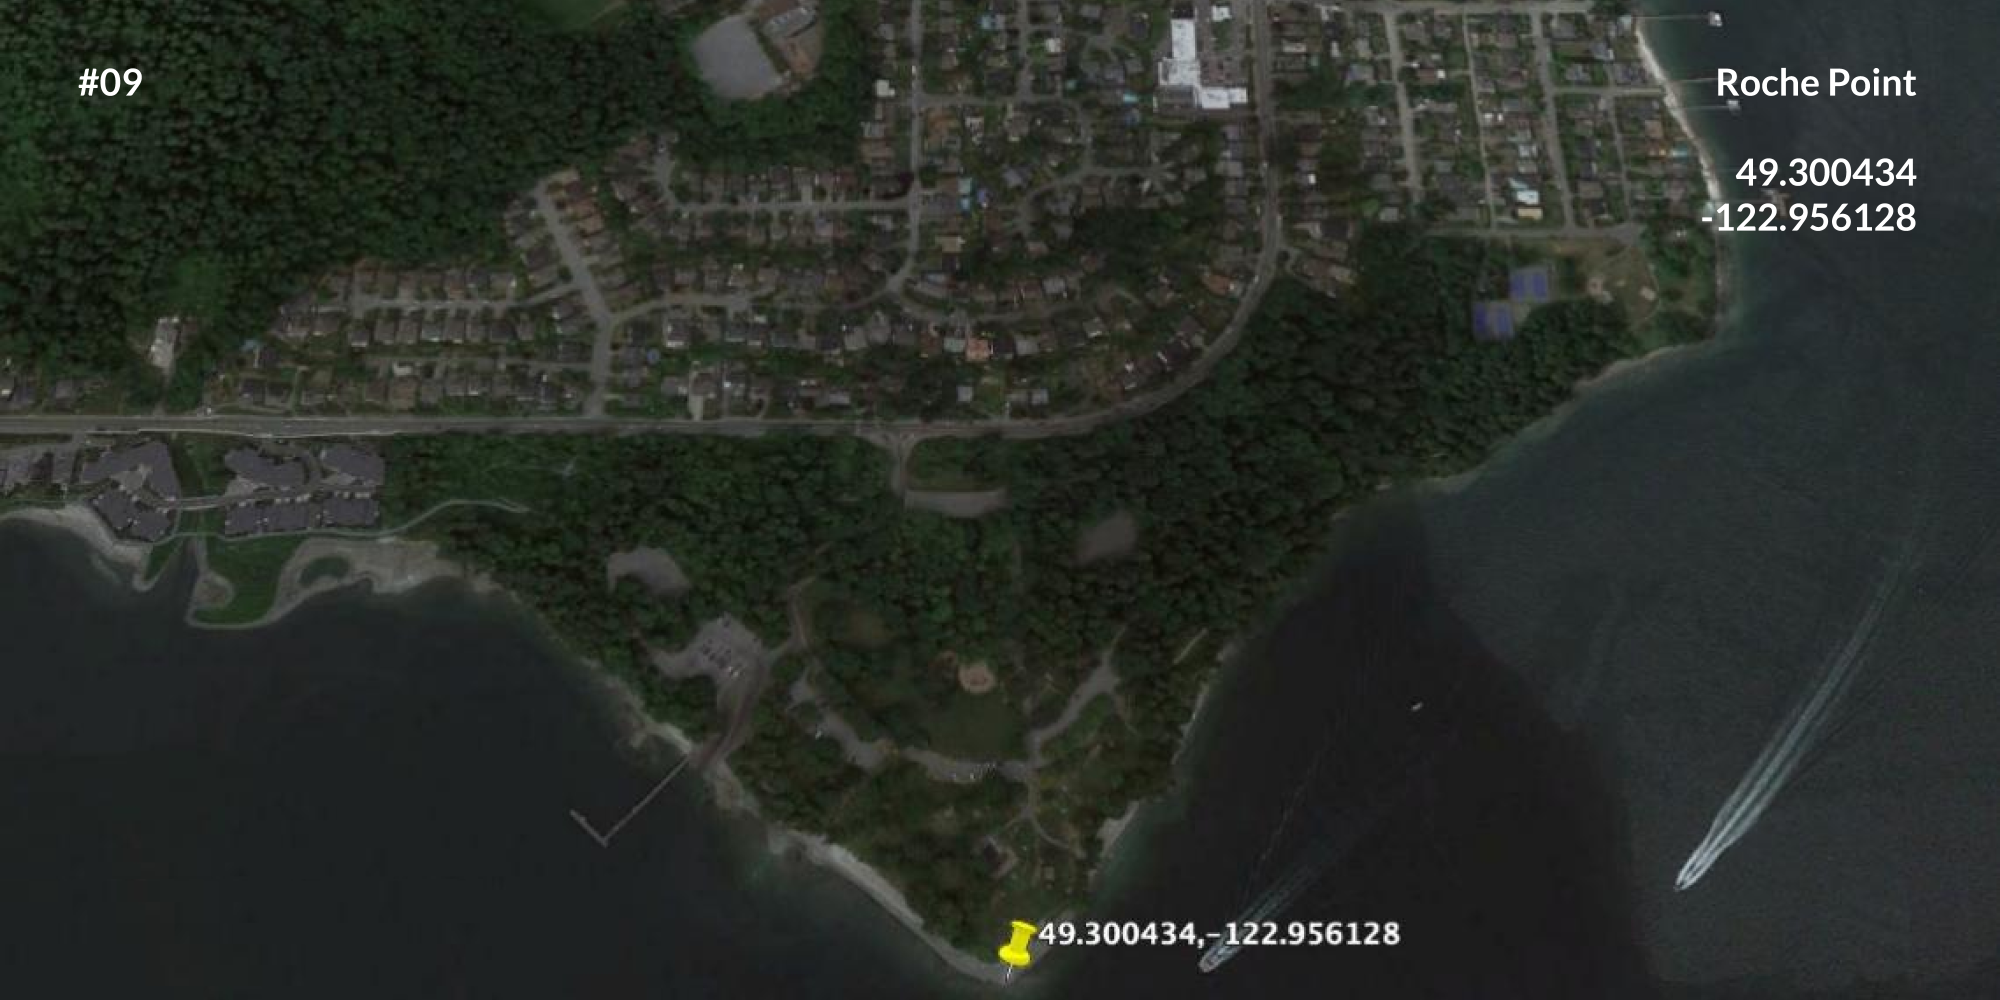
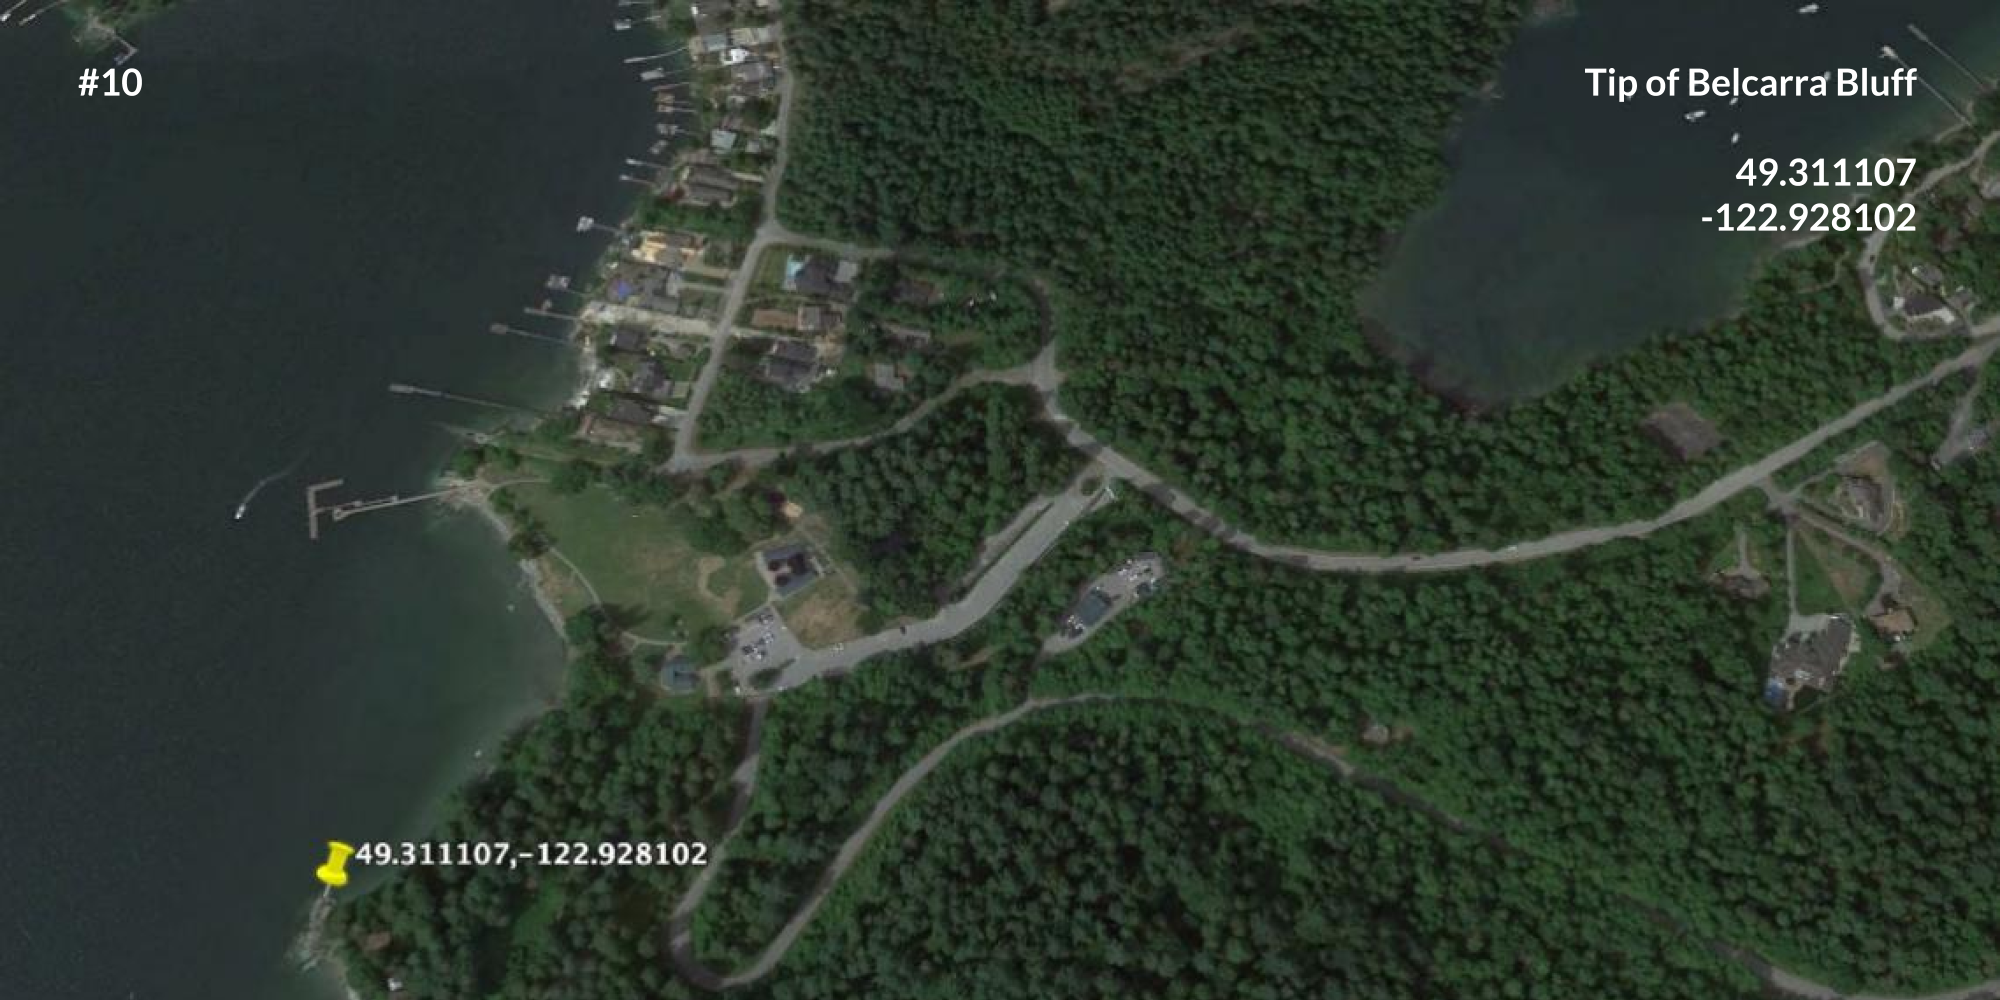
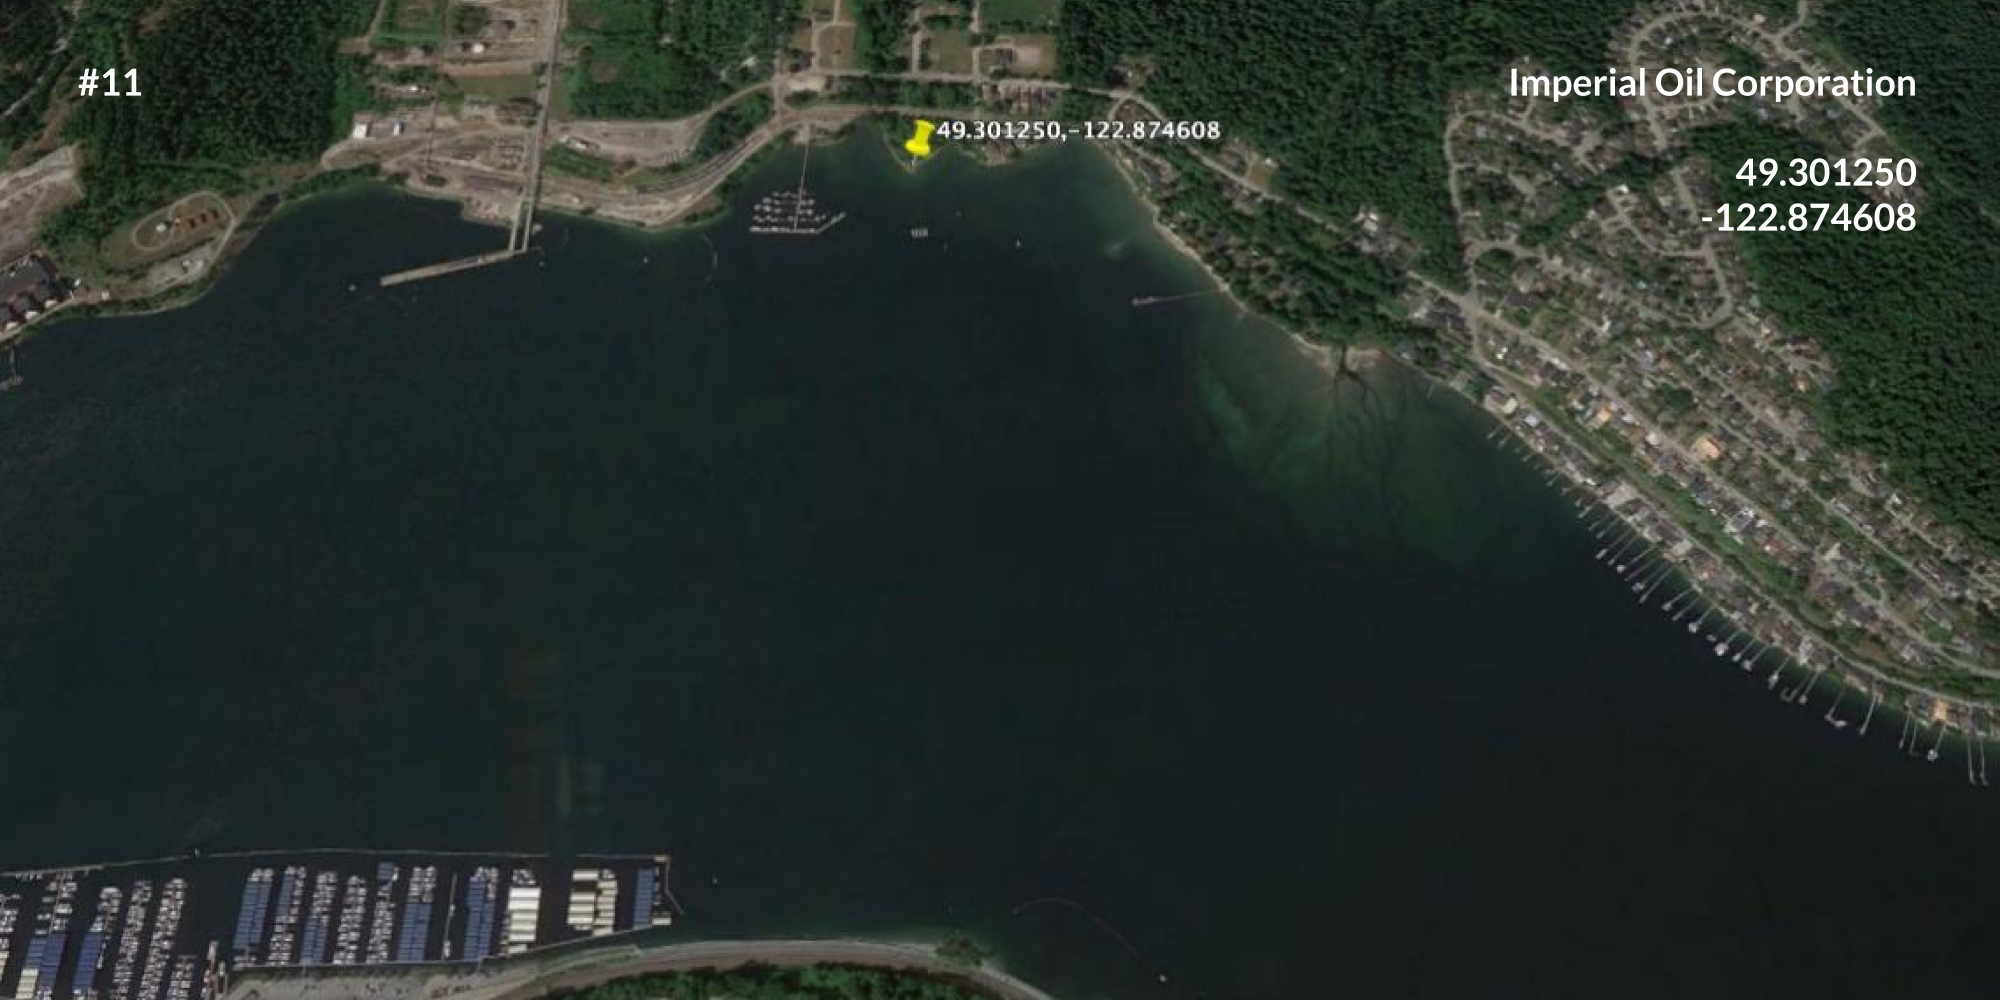
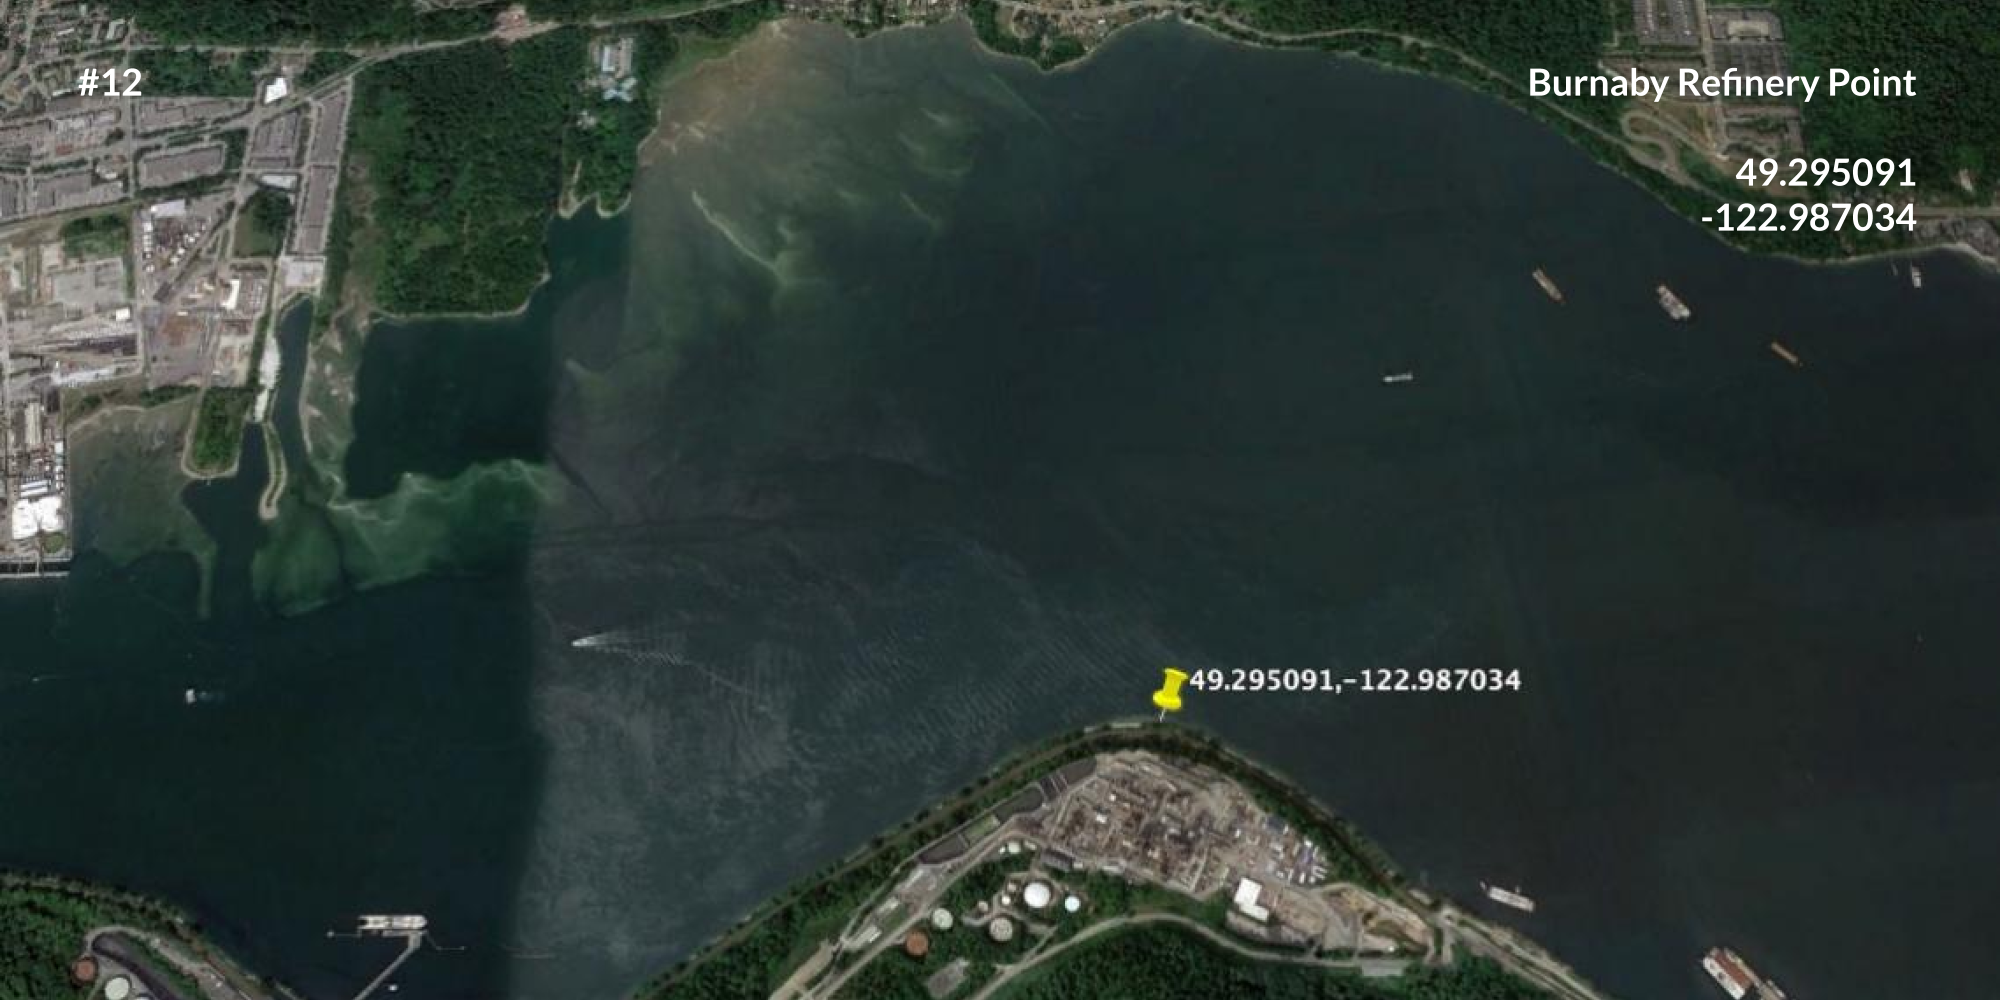
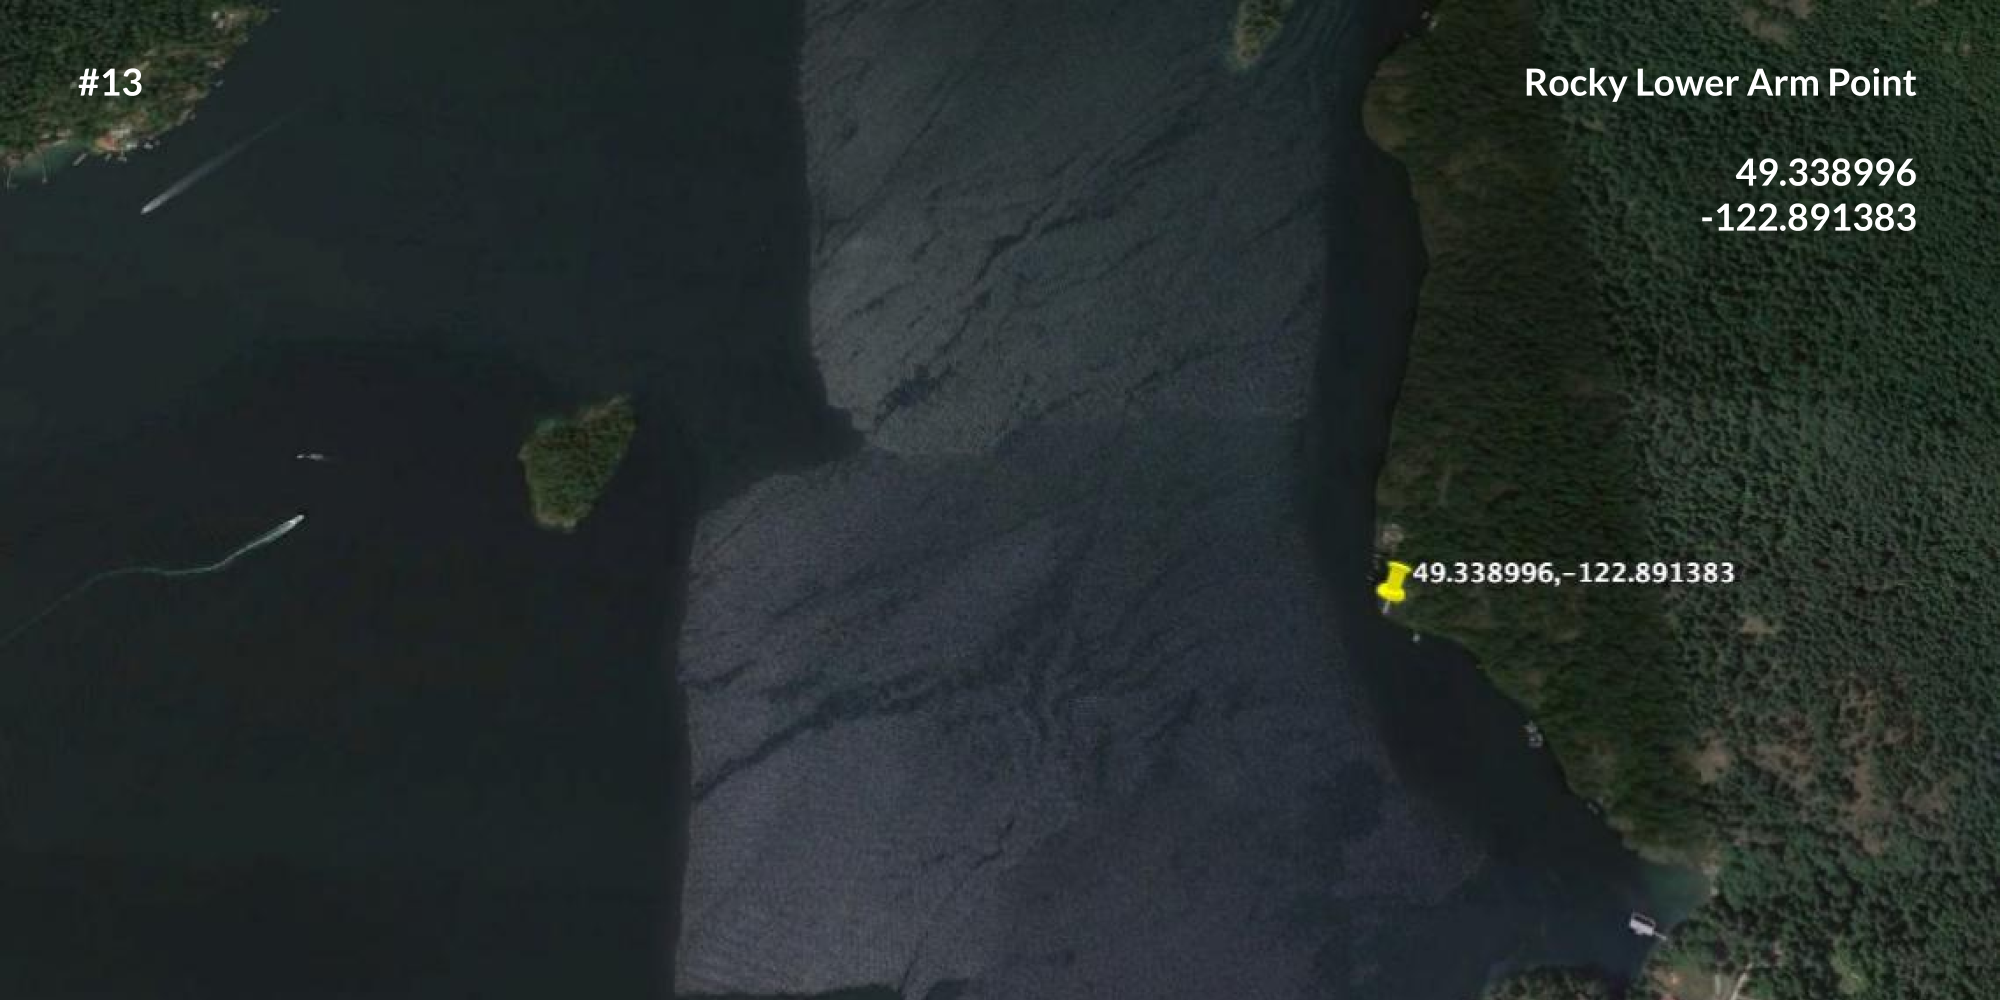
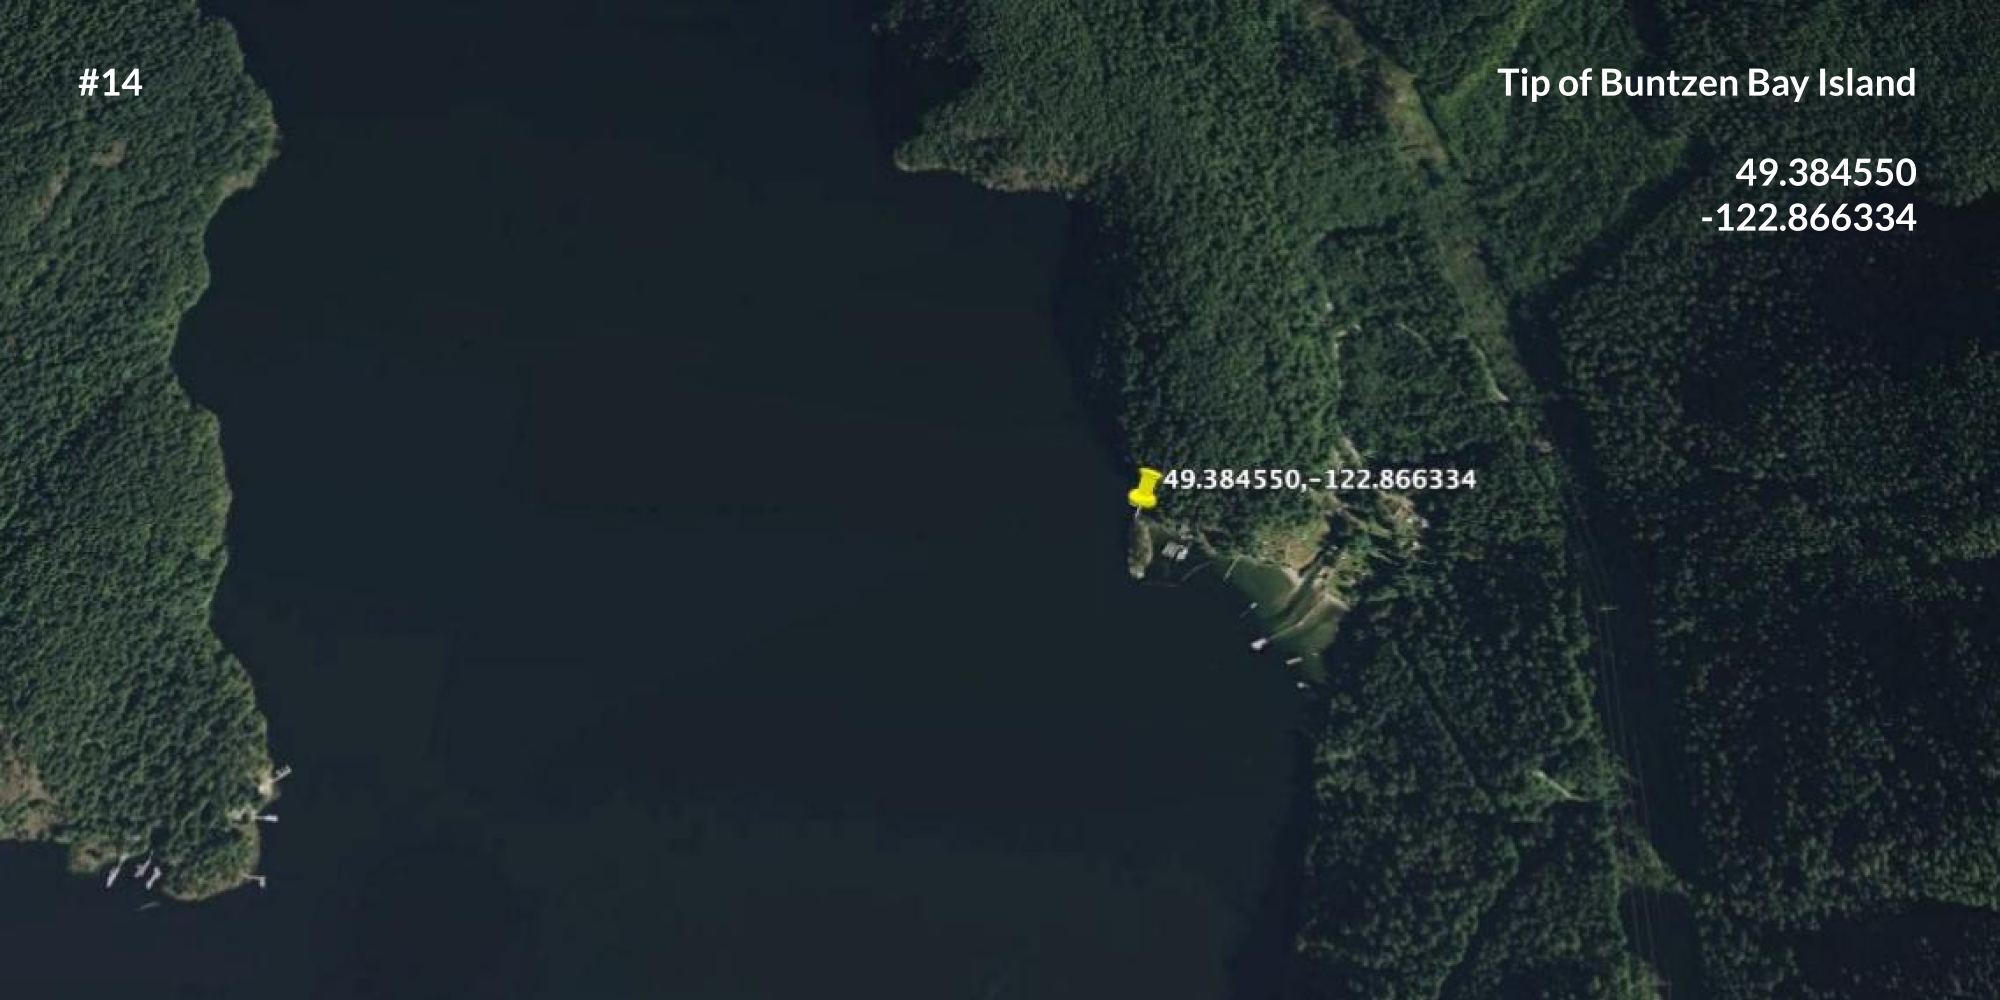
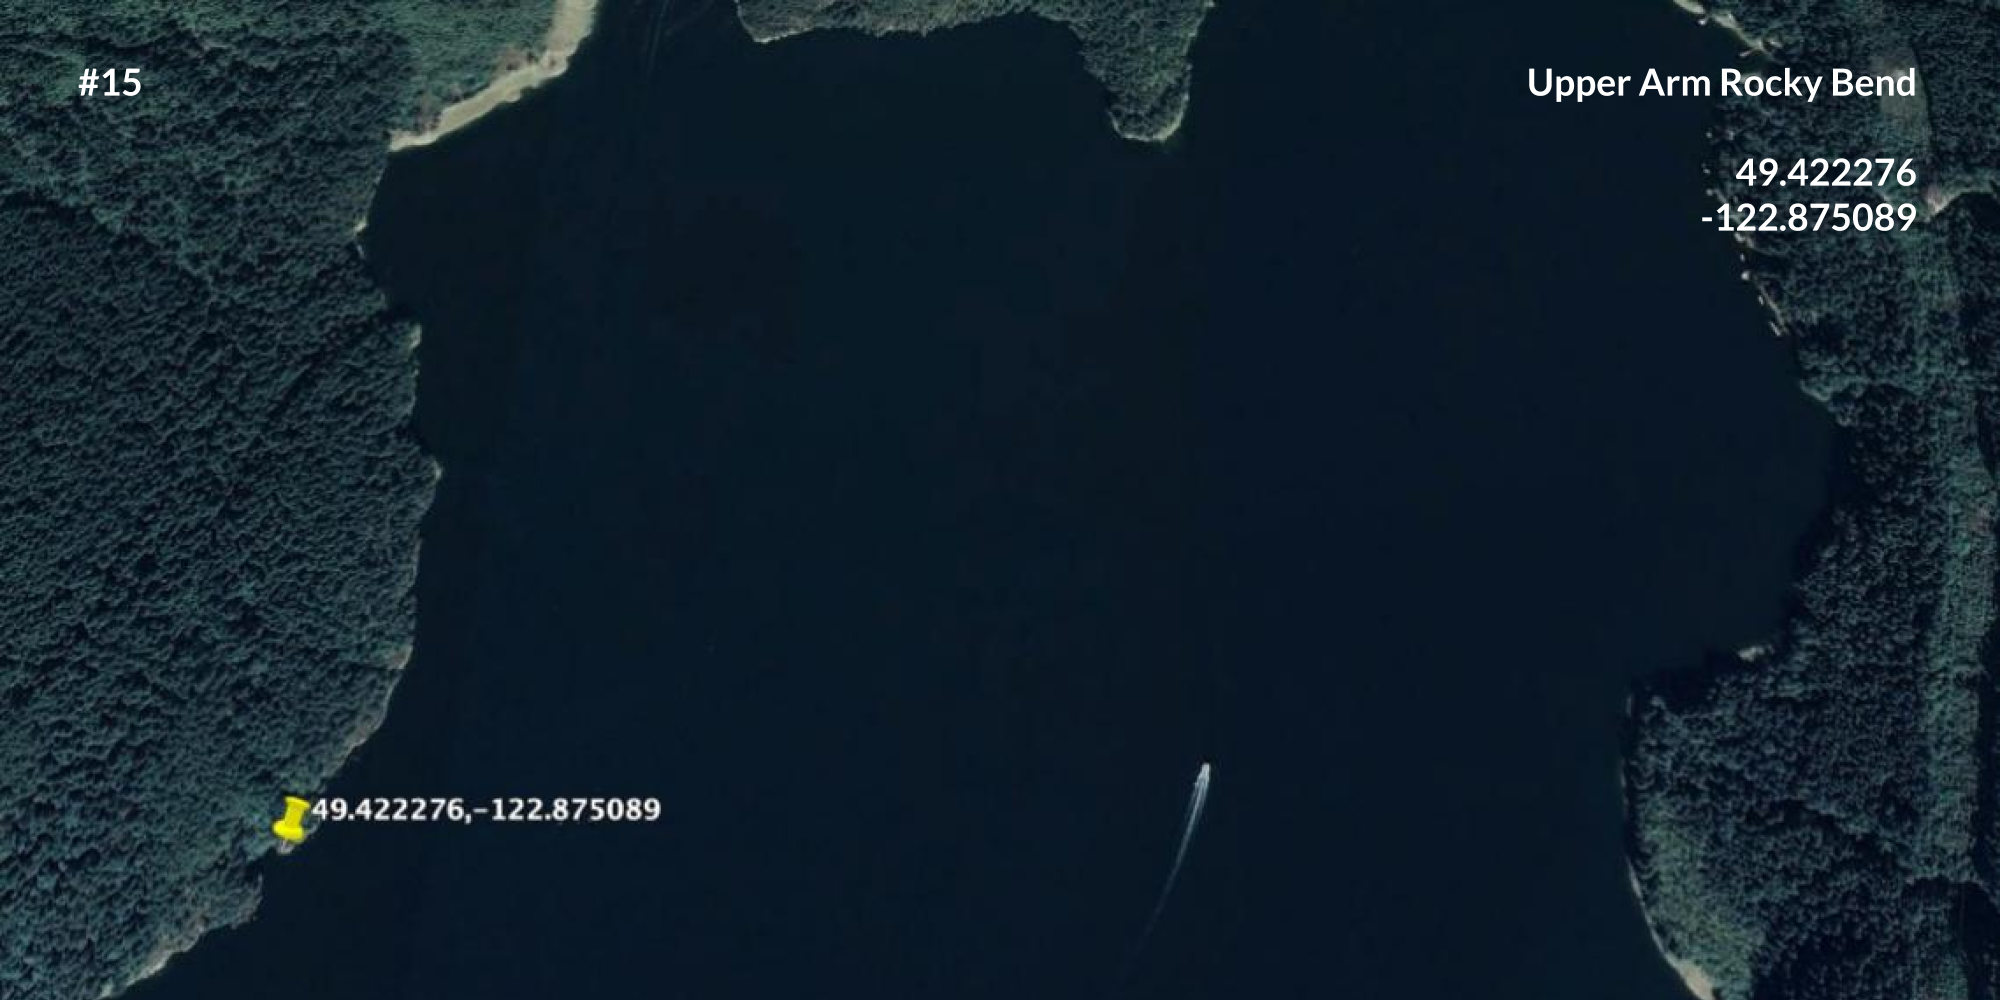
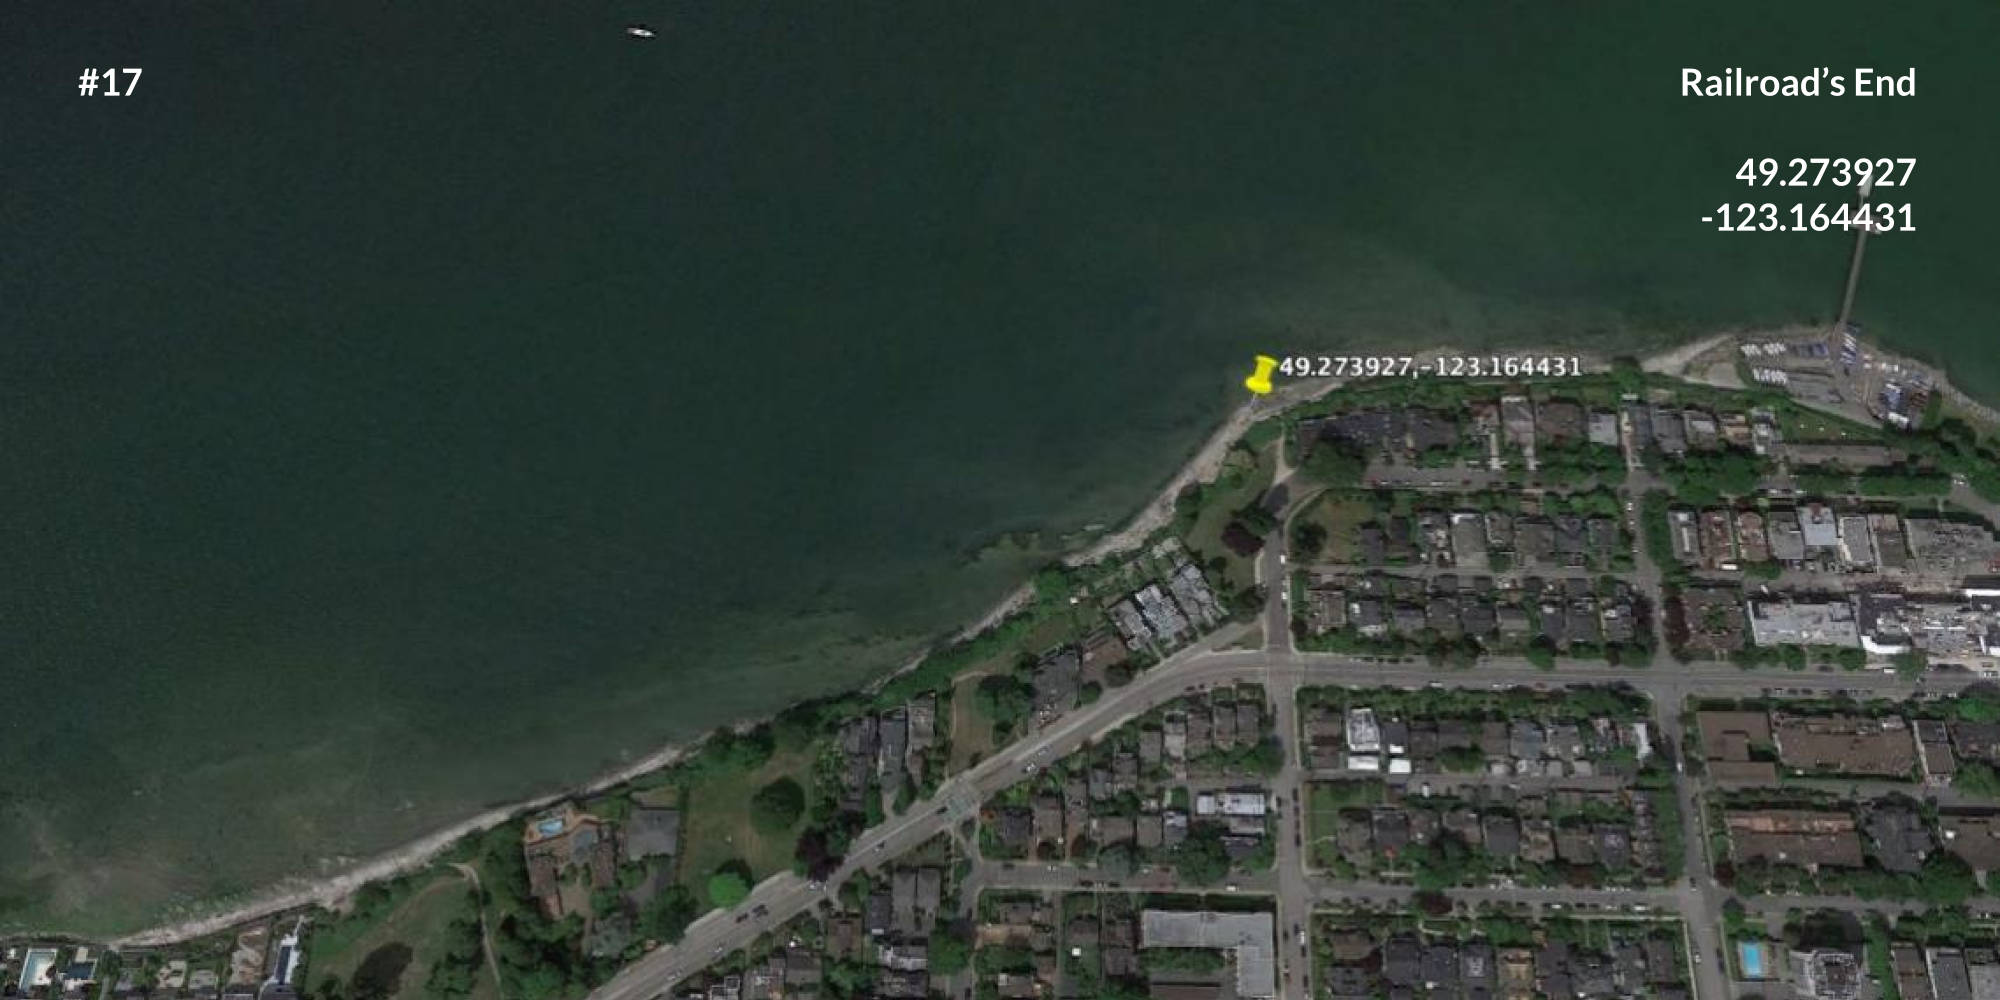
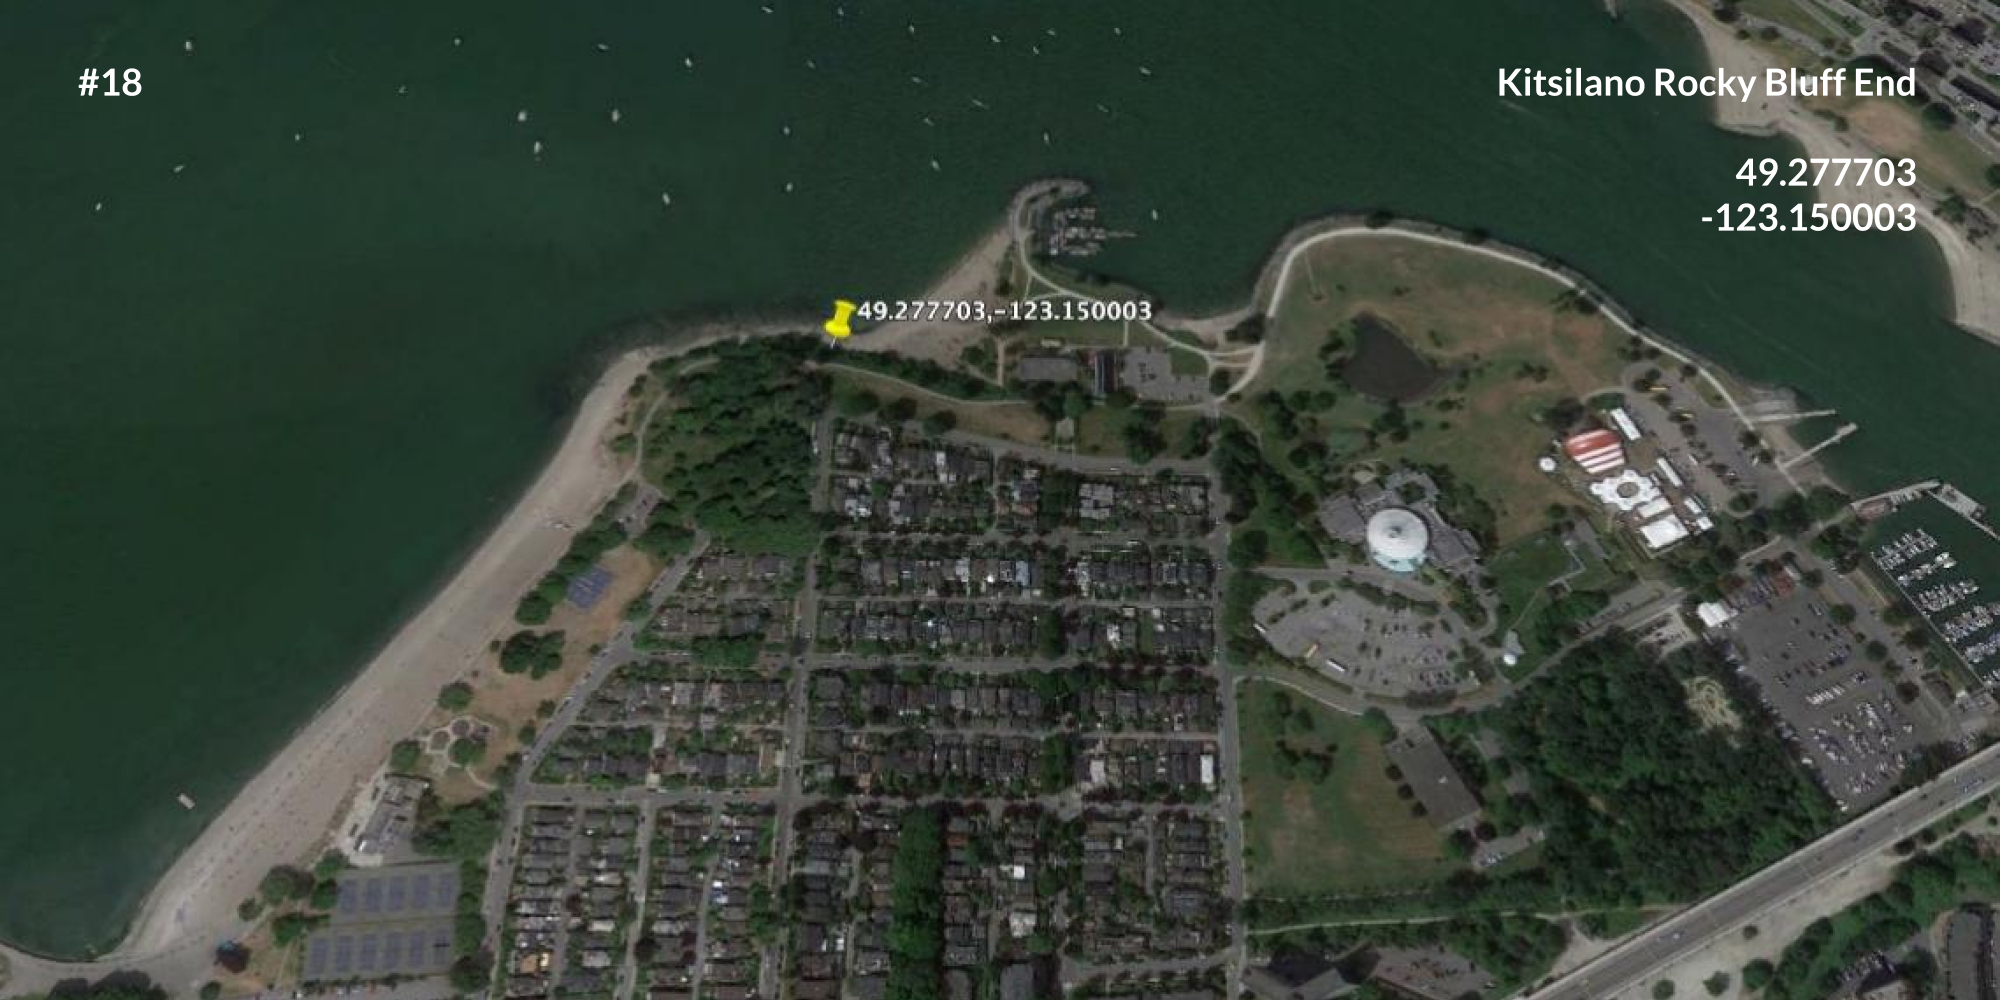
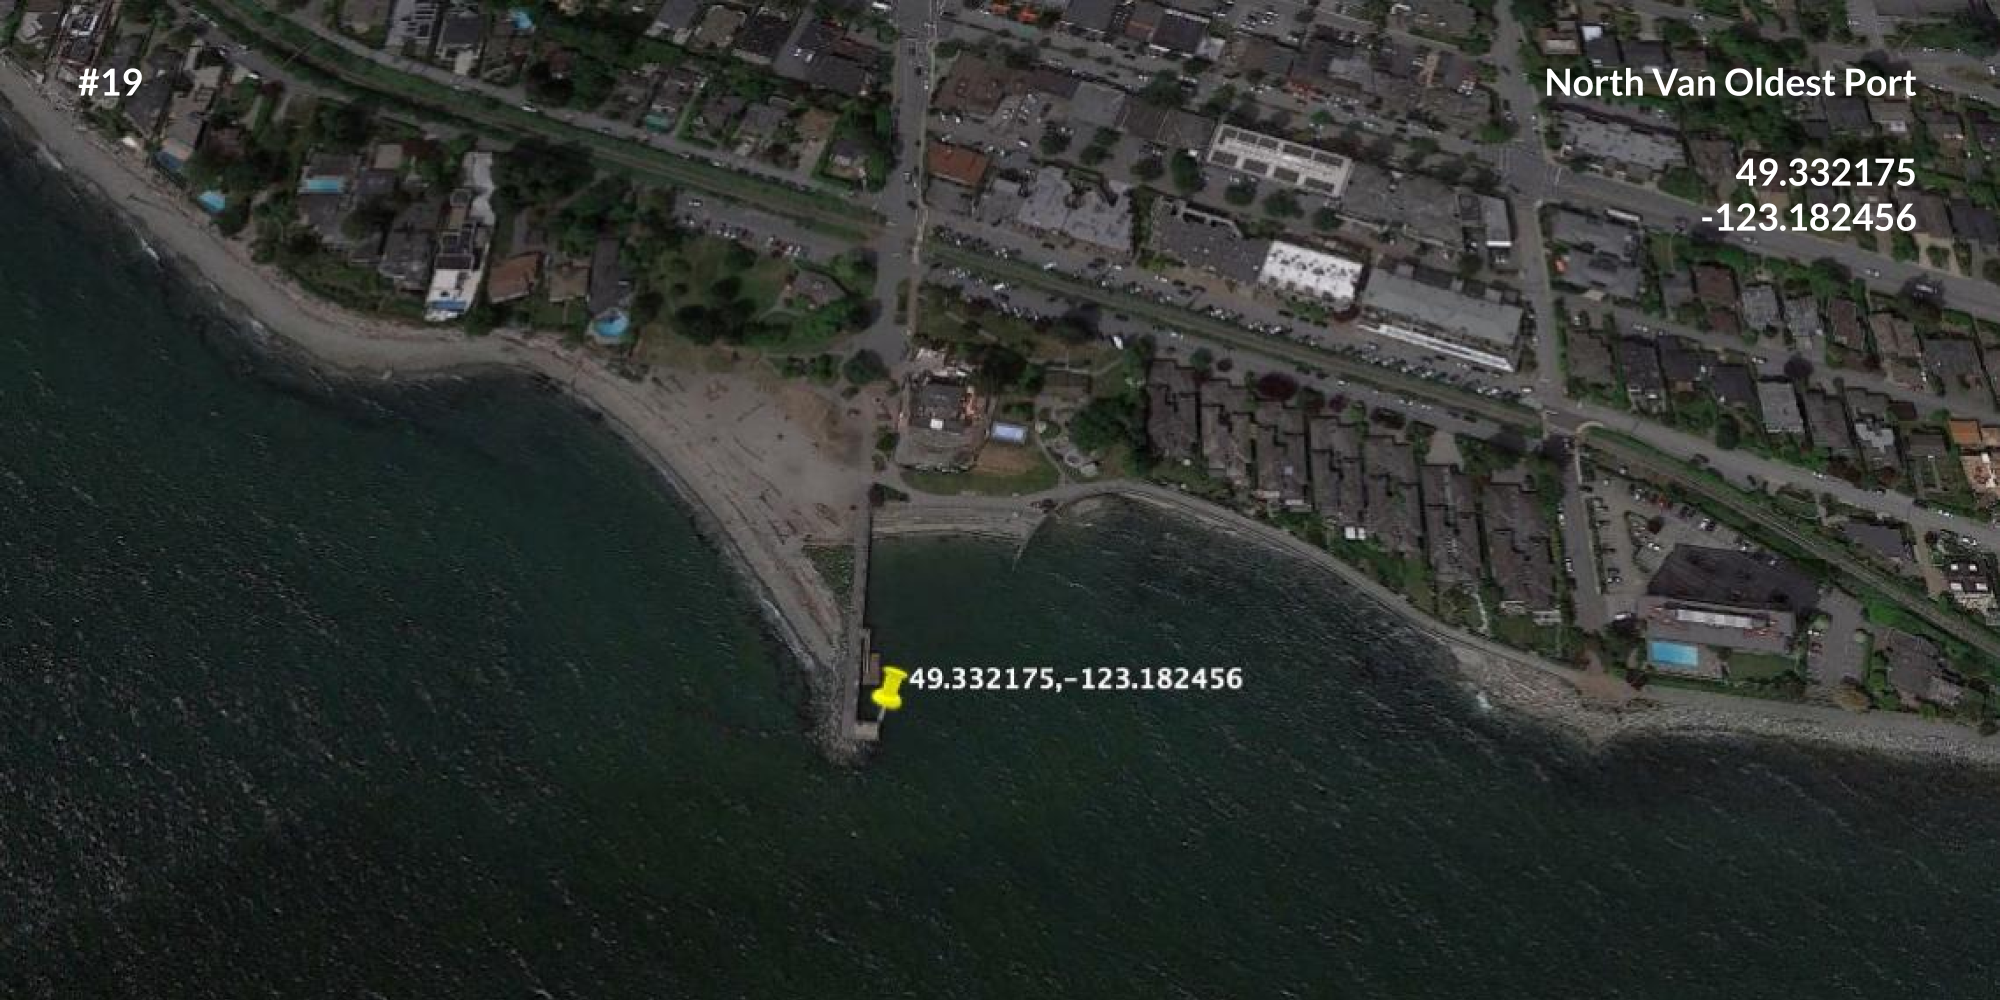
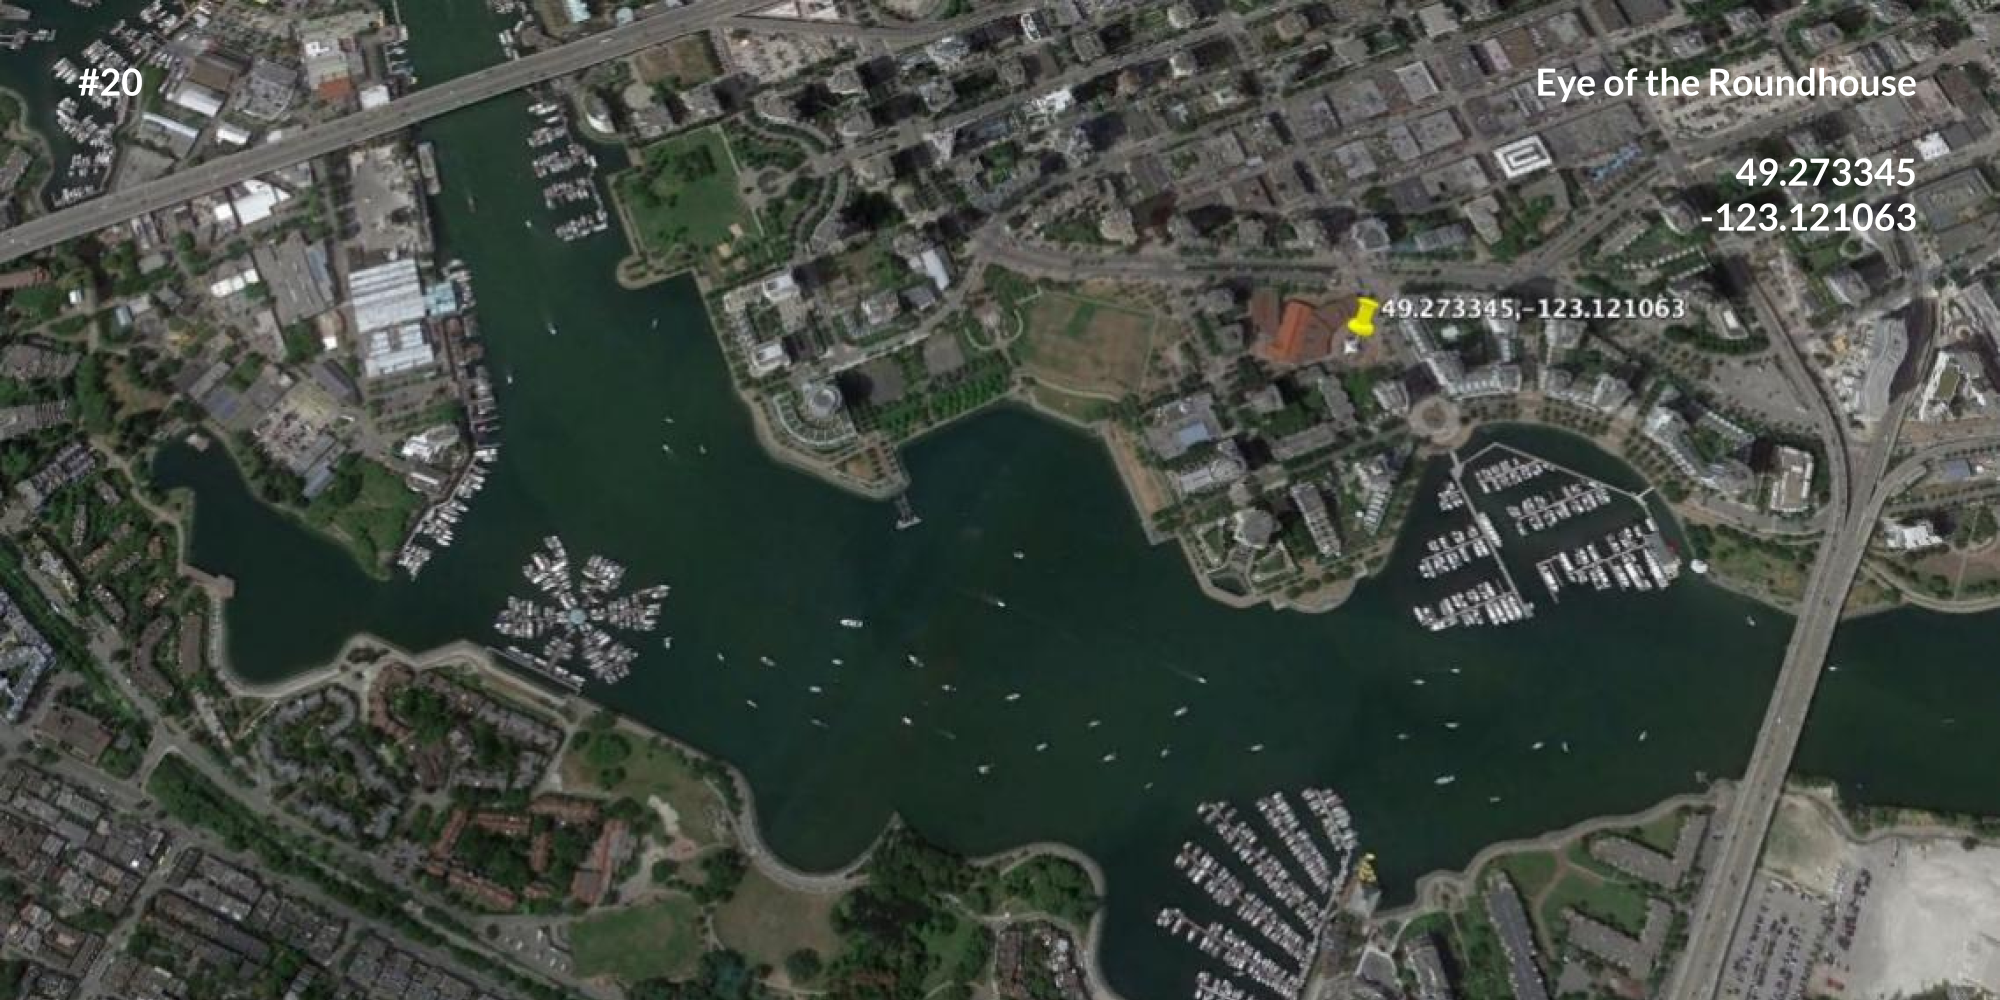
Control points are spots in a region of interest that are known to be constant over time, so they can be used to georectify old maps. For visual identification, the following screenshots show the surroundings of twenty key control points for Burrard Inlet.


Quick code to plot these control points:
Controls=[49.329922,-123.264637;49.265027,-123.264511;
    49.308804,-123.156058;49.314034,-123.141435;49.300899,-123.116997;
    49.282447,-122.837709;49.297609,-122.926267;49.306992,-123.135717;
    49.300434,-122.956128;49.311107,-122.928102;49.301250,-122.874608;
    49.295091,-122.987034;49.338996,-122.891383;49.384550,-122.866334;
    49.422276,-122.875089;49.337776,-123.249892;49.273927,-123.164431;
    49.277703,-123.150003;49.332175,-123.182456;49.273345,-123.121063];
X=Controls(:,1);Y=Controls(:,2);Controls=cat(2,Y,X);
scatter(Controls(:,1),Controls(:,2),2000,'Xr');
scatter(Controls(:,1),Controls(:,2),2000,'Or');