
#011 - Scanning the basin
From mountain summits to seabed, the animation below shows in white pixels a scan of the Burrard Inlet basin in 300 slices, with the high tide shoreline in shown in blue. The animation is based on a log10 transformation of the histogram shown below.
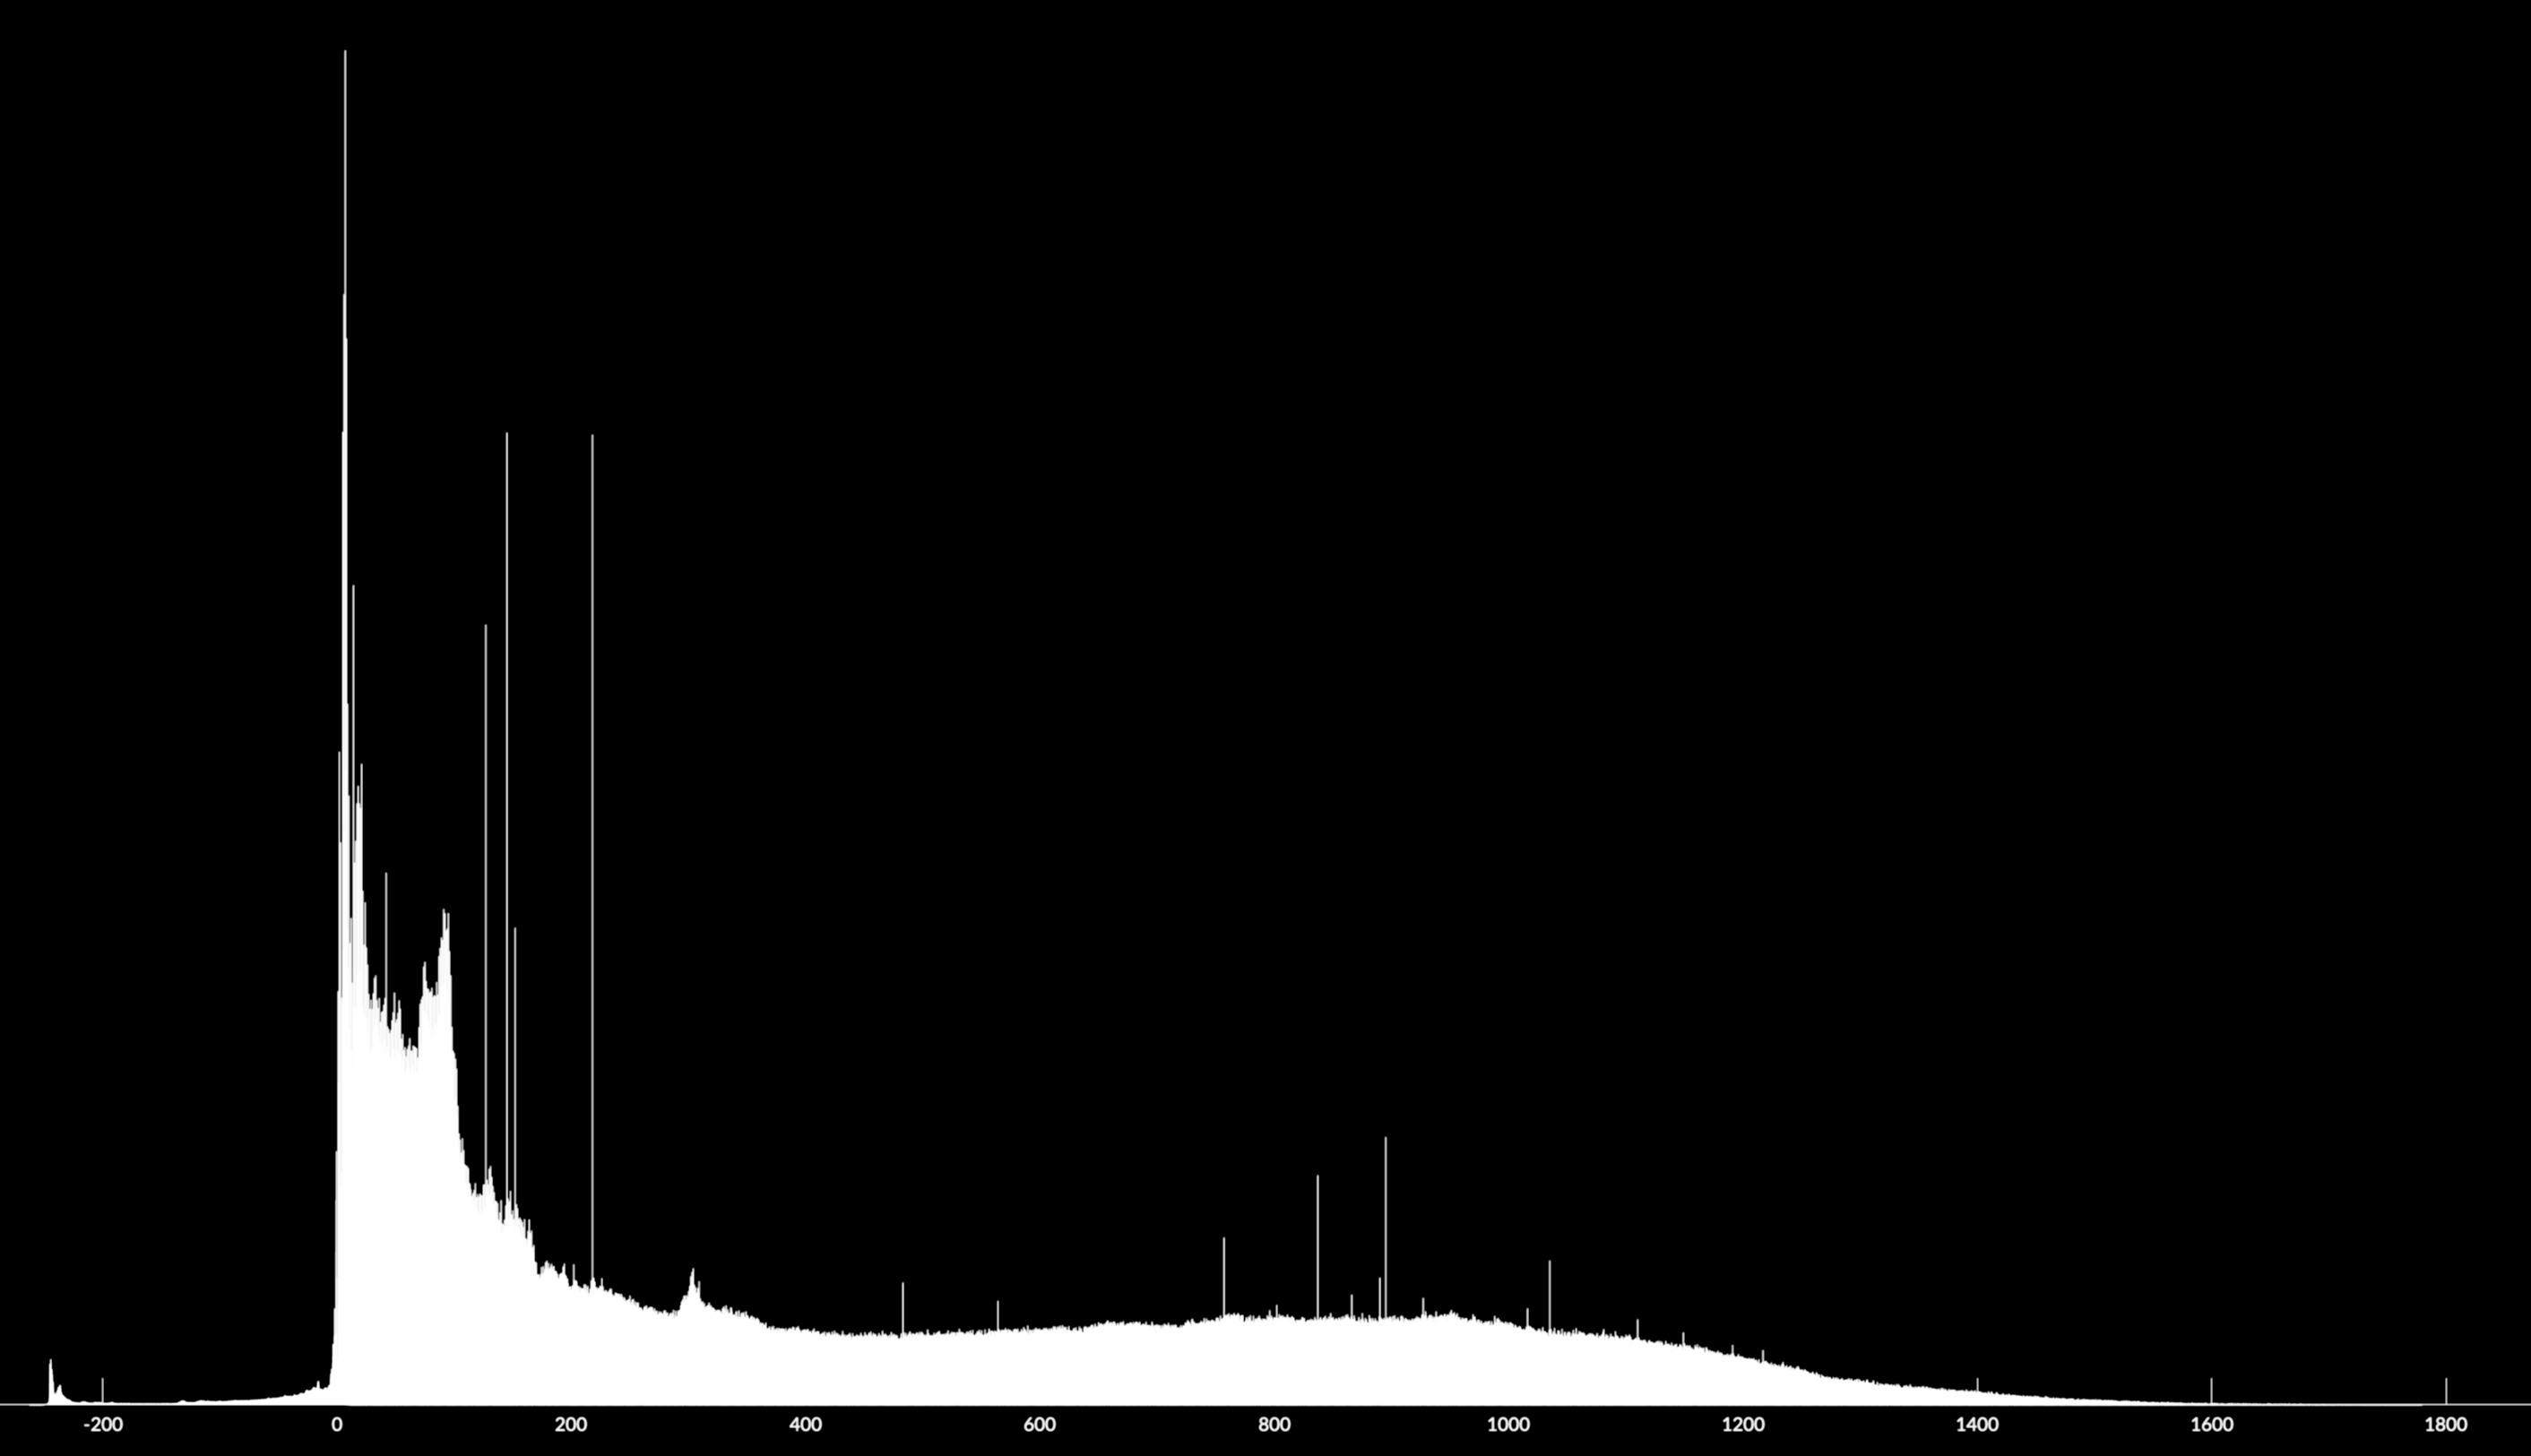
Quick flashes of white are very flat regions, in this case lakes and reservoirs scattered in the North Shore mountains. These flashes are also present as scattered peaks in the histogram above, where regions of pixels share the same evelation value, because these regions are perfectly flat. Overall, the most common elevation values cluster around 0 meters, or sea level at low tide, which explains with the scan increases in speed as it approaches the shoreline region.