#007 - Map vectorization method
Described here is a method to extract the intertidal surface area from old maps, and georectify it into a modern grid to compare with modern datasets (e.g. cartographic shapefiles, remote sensing imagery, altimetry scans).
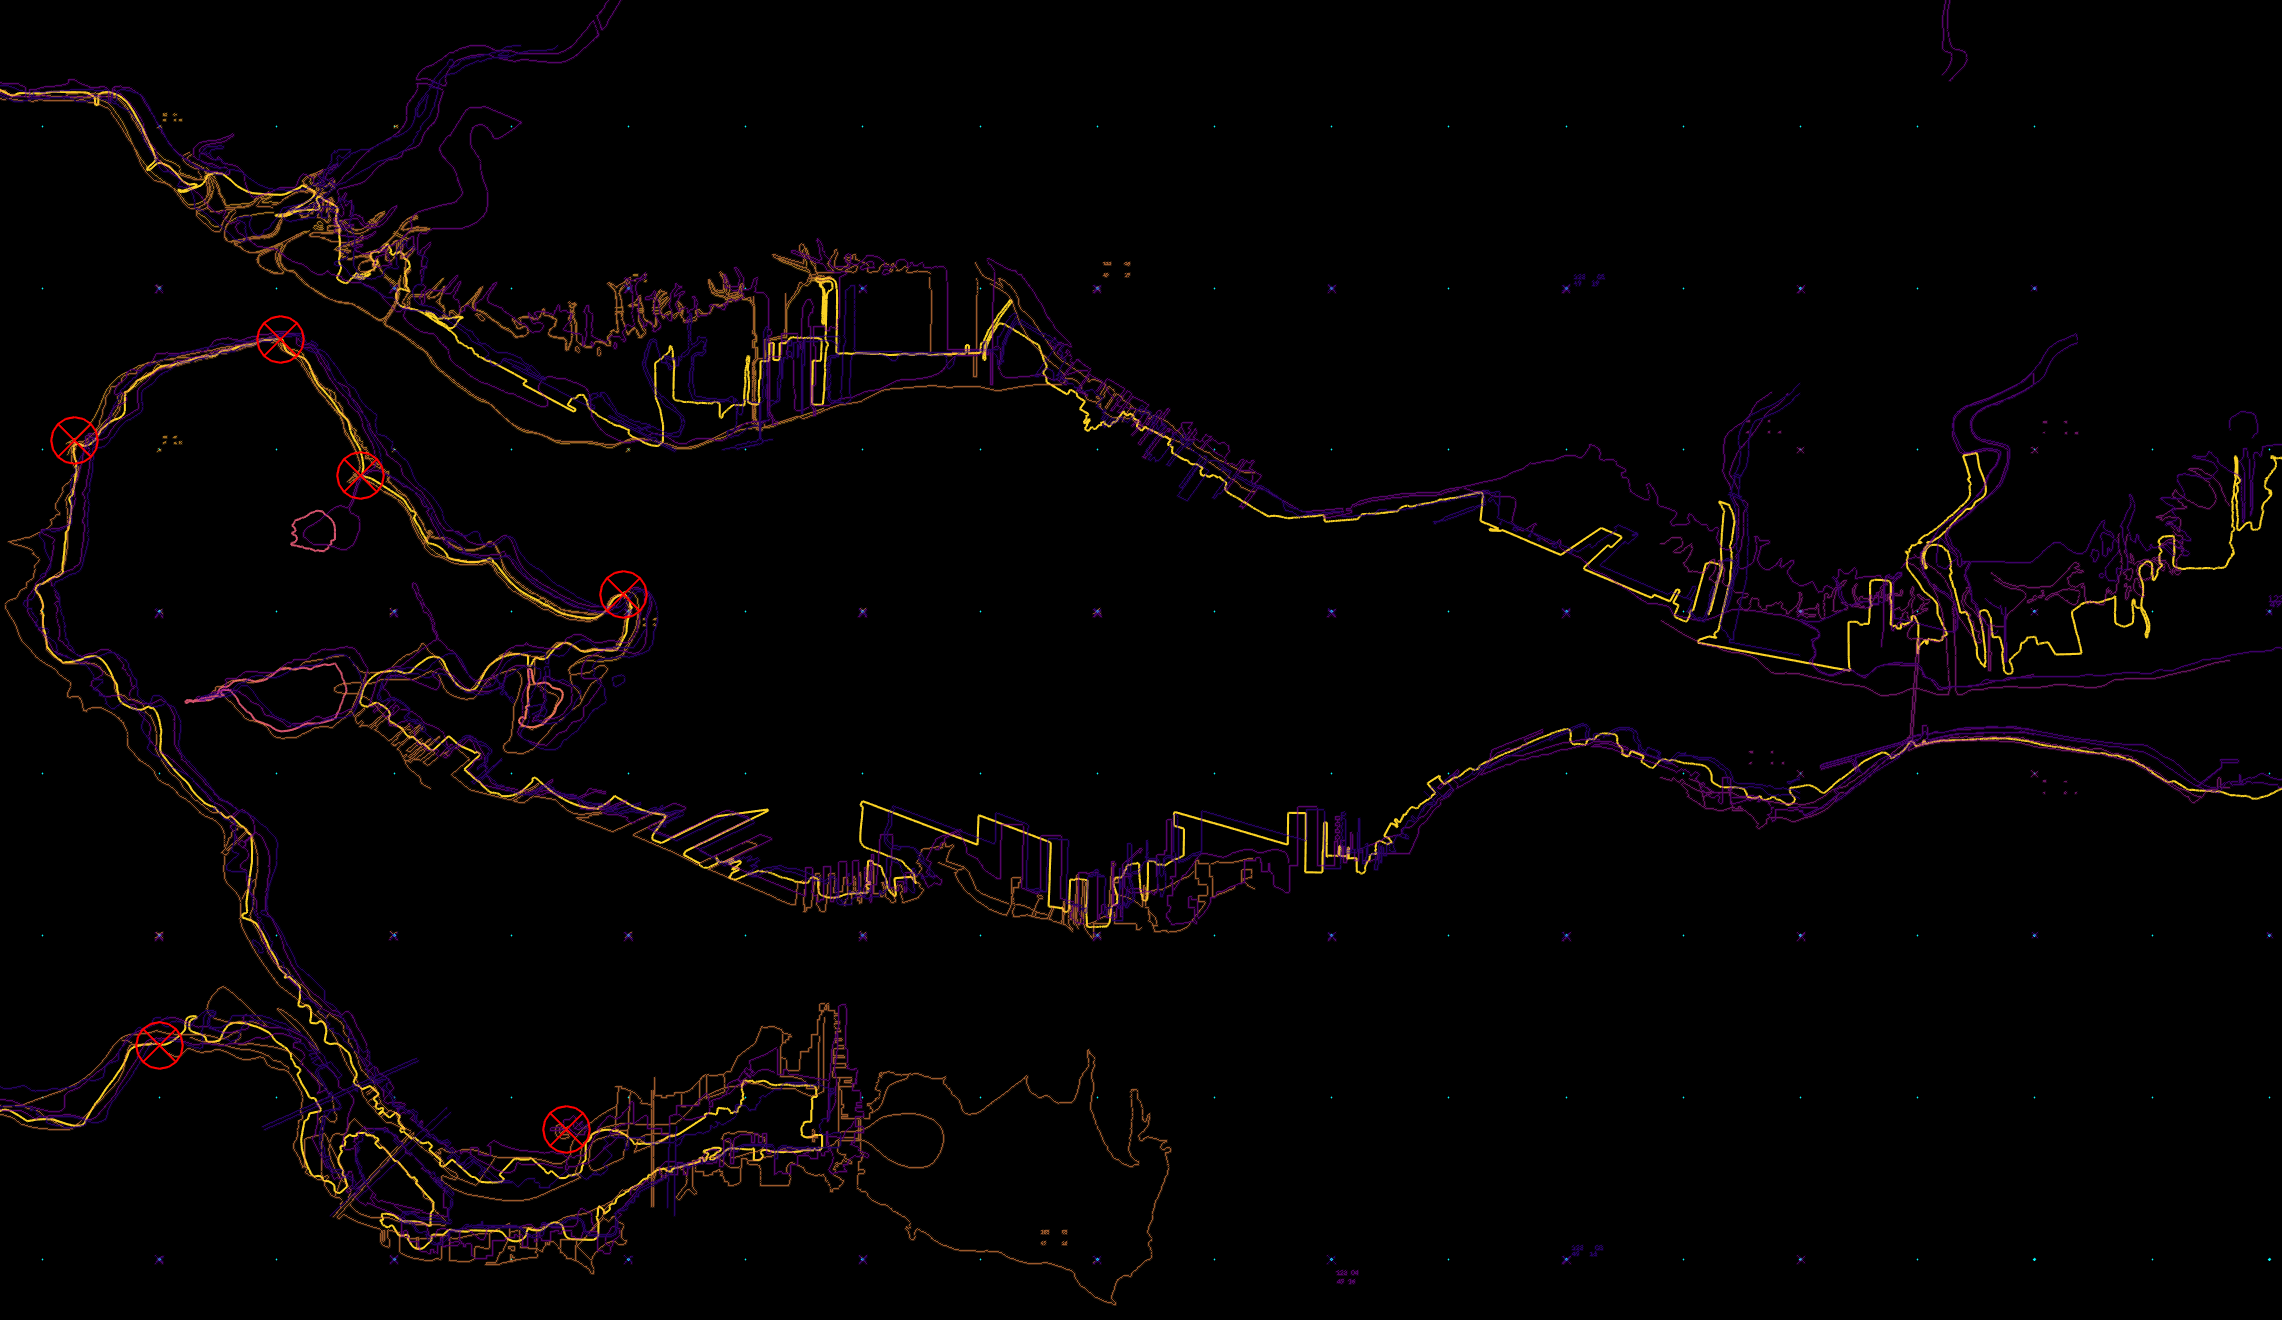
First the map is imported into Photoshop, and converted to grayscale. Using the Pen tool at 1px width and red RGB color, the entire span of the high tide line and low tide lines are traced. The Pen tool saves each stroke as a vector, which can be infinitely scaled.
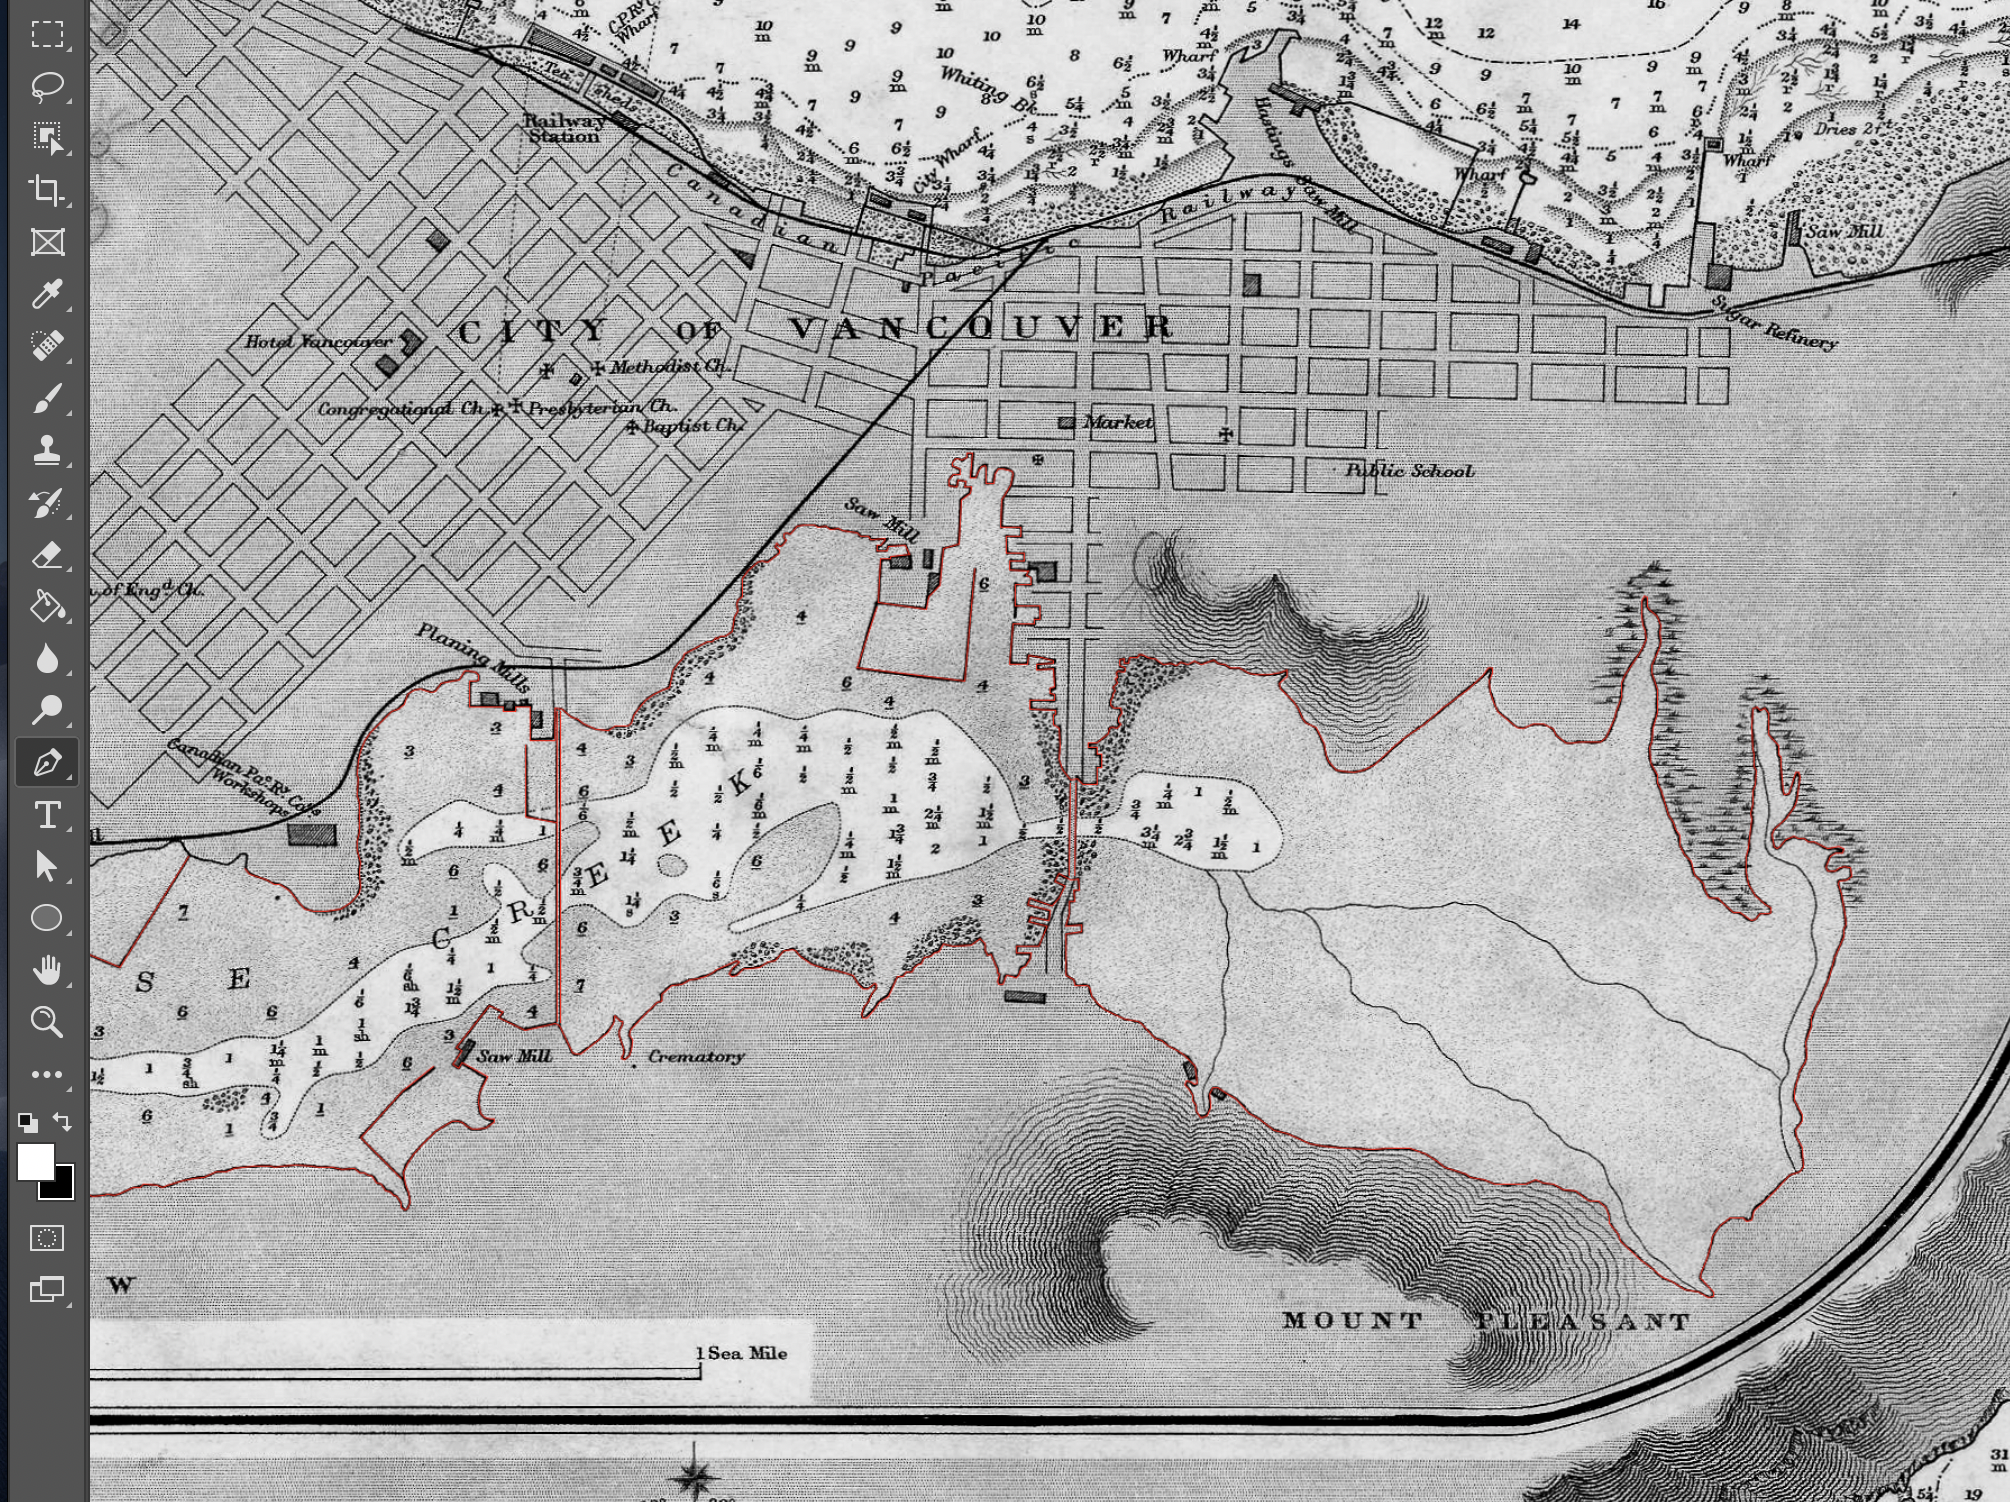
If the map has latitude and longitude grid lines, the intersections are marked with small drawn red crosses. All intersections must be marked, to create the lattice that represents the paper itself, which can help later to resolve distortions. Once all tracing is complete, the shapefiles are imported into a new 600dpi 3000x3000 pixel canvas, and the shapefiles enlarged till they fill the entire surface. This maximizes resolution while optimizing for noise reduction - when importing into Matlab close to 99% of the weight of the original image will be removed.
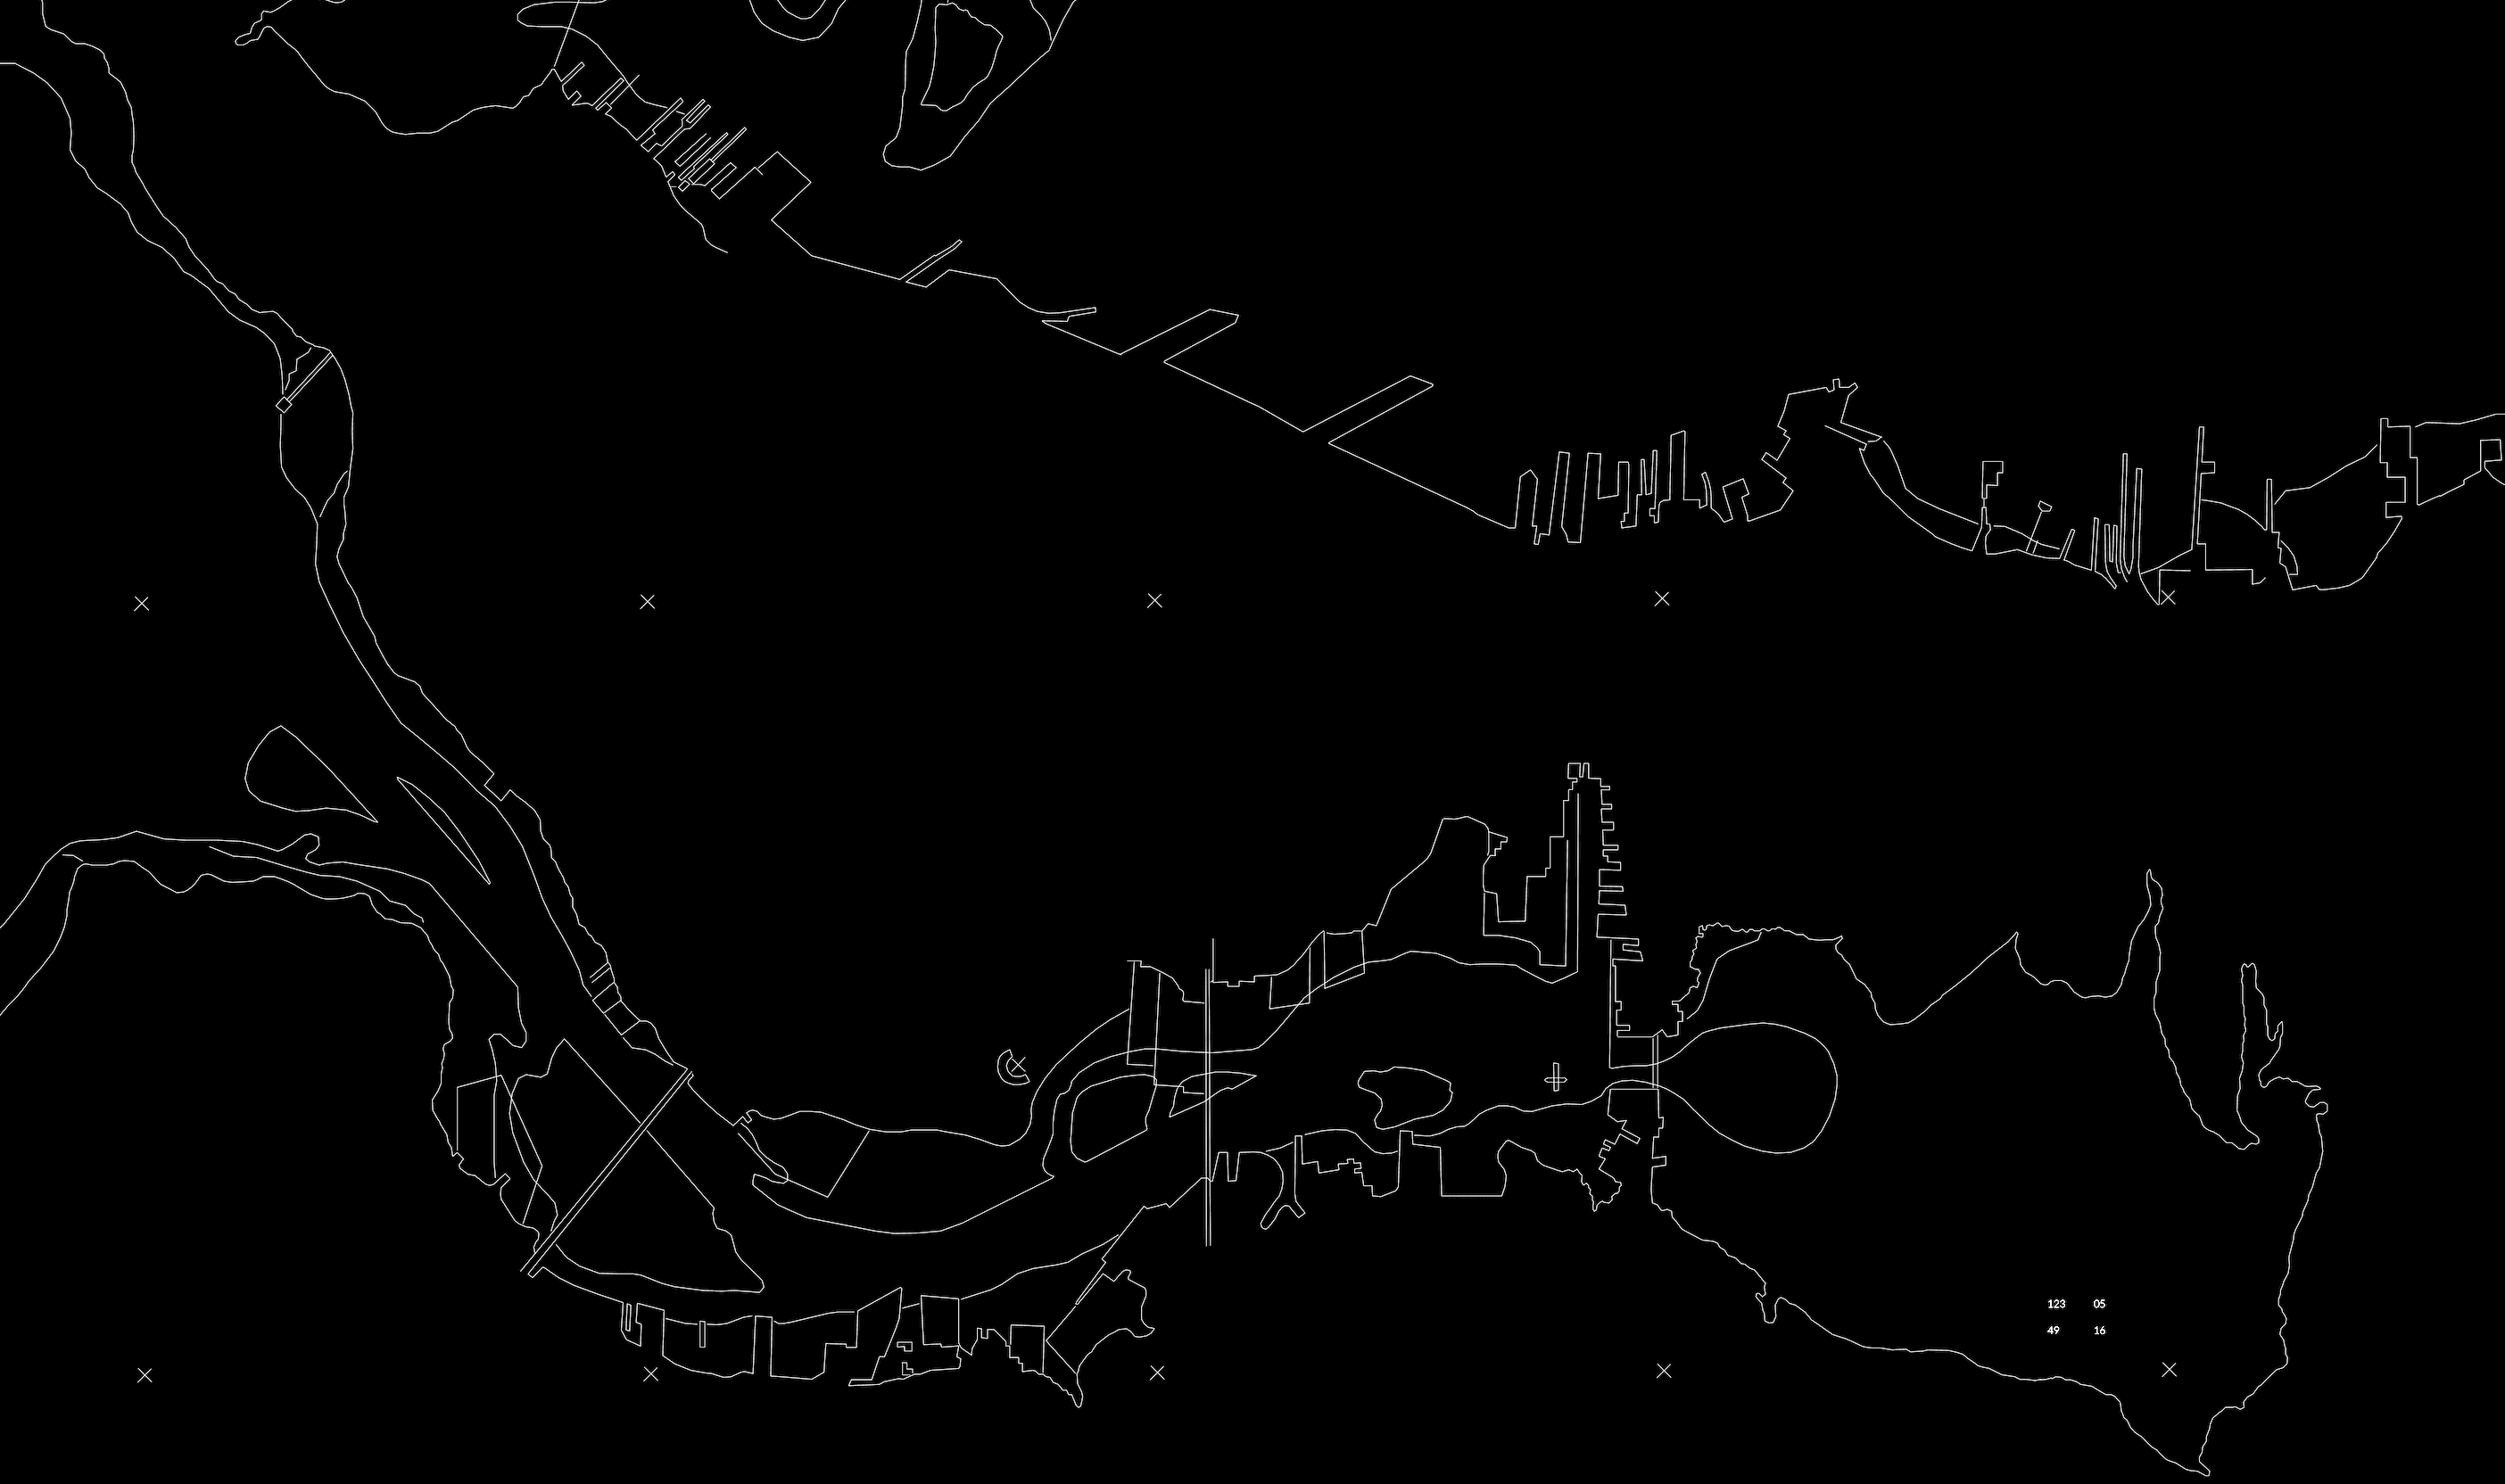
In Matlab, the high resolution map is converted into X and Y vectors, keeping only the pixels with data. This point cloud can now be georectified by picking the four corner cross marks (each a key grid intersection) and extracting their X and Y point index. These four image indices are paired with the four equivalent latitude and longitude WGS decimal values. With these four pairs, a projective transformation matrix is calculated. This T-matrix can be multiplied intoto all indices of the point cloud at once, bringing the X and Y vectors into longitude and latitude georectified space, respectively.
Each map is unique, so there is no guarantee that the grid corresponds to modern geodetic standards. Further fine tuning requires control points, or specific regions of the map that are known to be unchanged, such as islands, rocky shoreline regions, or century-old streets and buildings.